Ahead of the the holiday in the US, equities fell on lighter trading. That said, overall volume levels on the downside move outpaced recent upsized trading volume days. That does not install a vote a confidence in my book.

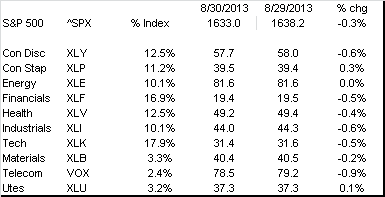
The price/volume heat map reflects the overall weakness of the trading, with supply coming out ahead of the demand by fairly wide margin. In fact, the best demand performance was seen in the staples sector (historically a defensive trade). Even so, demand-side moves in the staples sector only pushed 40% of the names in the group. That is as price gains added 40 basis points in value. Again, not a positive picture.


For Week Ending 8/30
Not much was spared in the selling on the week.

Nor was there any apparent demand.


The price/volume heat map reflects the overall weakness of the trading, with supply coming out ahead of the demand by fairly wide margin. In fact, the best demand performance was seen in the staples sector (historically a defensive trade). Even so, demand-side moves in the staples sector only pushed 40% of the names in the group. That is as price gains added 40 basis points in value. Again, not a positive picture.

For Week Ending 8/30
Not much was spared in the selling on the week.

Nor was there any apparent demand.

No comments:
Post a Comment