Thursday, January 17, 2013

High Volume High 1/17/13 Trading Day Edition

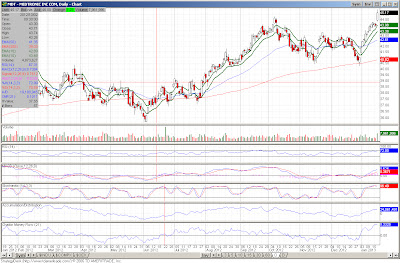
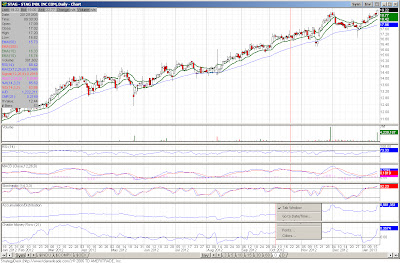
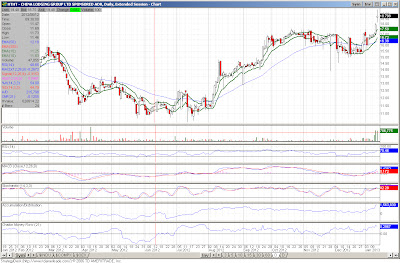
Quite a few names hitting the list today. One item of interest, seeing some strength in the broadcasting/advertising space with both CBS and LAMR making the list today. I also noticed at least one other name in the space making the screens despite it not making the visual criteria. Also seeing some strength in FITB, announcing better than expected earnings and the management stating the company had $1.5 billion in excess capital. Additionally, EBAY (which might as well be considered a bank with its Paypal unit) saw better earnings and the shareholders were rewarded. The small-cap stock FRGI was up nearly 7% on essentially no news. Ditto for HRB. This is while FUl reported better than expected earnings. Lastly, KSWS was sold to a Korean firm (so disregard the stock for any investment) and MDT's shares gained on an upgrade from the Street.


Volume Off the High 1/17/13 Trading Day Edition

Only a few new volume off the high names in today's trading. WSM sold off after the company announced it had same store sales of about 4% and reiterated Q4 estimates. I guess someone was looking for more. Then there is FET, down nearly 8% after the company reduced guidance. Last is NTCT, which reported earnings that beat estimates and increased guidance. I guess another company where the Street was looking for more.


Inflation- the Legacy of the Federal Reserve's 100 Years

Why is this a surprise....


and the paper the clip references.....

High Volume High 1/16 Trading Day Edition

A few new High Volume Highs. First there is ALNY and let me say you do not see that every day. ALNY register and prices a secondary stock offering and stock goes UP. Makes me a little suspect of the move, but what do I know. Then you have PDM, which appears to have increased, on some volume, on no apparent news. There is also JBLU, which is a one of two airlines to make the initial screening test, noting the second stock did not make the visual test. My guess is that the airline industry stocks are reacting positively to United attempt to raise prices on tickets for the second time in the year. As for PRLB, a 3D printing company, the company's management supposedly presented at a conference. The action in stock may be a follow on effect to any positive comments...... at least that is what I am gleaming as there is no news. As for the last two names, STAG and STZ, both benefited from analyst upgrades.


Volume Off the High- 1/16/13 Trading Day Edition

A few names coming off the high, on volume, for the 1/16 trading day garnered that distinction by being awarded a downgraded by the analyst community. Specifically, IRWD, BCO, and CLSN all were hit with downgrades. As for NTRS, the company reported earnings that missed analysts estimated.


The 2013 Outlook for Gold- a la HSBC


Wednesday, January 16, 2013

Titan Infographic

I have been absolutely enthralled with Titan since waiting in anticipation of the Huygens probe touchdown on the moon. This place is just fascinating.

Infographic: the facts about Titan's heavy atmosphere, lakes of hydrocarbons and the possibility of life

Source SPACE.com: All about our solar system, outer space and exploration

Where Is the Inflation- an Austrian Point of View

By Mark Thorton

Critics of the Austrian School of economics have been throwing barbs at Austrians like Robert Murphy because there is very little inflation in the economy. Of course, these critics are speaking about the mainstream concept of the price level as measured by the Consumer Price Index (i.e., CPI).
Let us ignore the problems with the concept of the price level and all the technical problems with CPI. Let us further ignore the fact that this has little to do with the Austrian business cycle theory (ABCT), as the critics would like to suggest. The basic notion that more money, i.e., inflation, causes higher prices, i.e., price inflation, is not a uniquely Austrian view. It is a very old and commonly held view by professional economists and is presented in nearly every textbook that I have examined.

This common view is often labeled the quantity theory of money. Only economists with a Mercantilist or Keynesian ideology even challenge this view. However, only Austrians can explain the current dilemma: why hasn’t the massive money printing by the central banks of the world resulted in higher prices.

Austrian economists like Ludwig von Mises, Benjamin Anderson, and F.A. Hayek saw that commodity prices were stable in the 1920s, but that other prices in the structure of production indicated problems related to the monetary policy of the Federal Reserve. Mises, in particular, warned that Fisher’s “stable dollar” policy, employed at the Fed, was going to result in severe ramifications. Absent the Fed’s easy money policies of the Roaring Twenties, prices would have fallen throughout that decade.

So let’s look at the prices that most economists ignore and see what we find. There are some obvious prices to look at like oil. Mainstream economists really do not like looking at oil prices, they want them taken out of CPI along with food prices, Ben Bernanke says that oil prices have nothing to do with monetary policy and that oil prices are governed by other factors.

As an Austrian economist, I would speculate that in a free market economy, with no central bank, that the price of oil would be stable. I would further speculate, that in the actual economy with a central bank, that the price of oil would be unstable, and that oil prices would reflect monetary policy in a manner informed by ABCT.

That is, artificially low interest rates generated by the Fed would encourage entrepreneurs to start new investment projects. This in turn would stimulate the demand for oil (where supply is relatively inelastic) leading to higher oil prices. As these entrepreneurs would have to pay higher prices for oil, gasoline, and energy (and many other inputs) and as their customers cut back on demand for the entrepreneurs’ goods (in order to pay higher gasoline prices), some of their new investment projects turn from profitable to unprofitable. Therefore, you should see oil prices rise in a boom and fall during the bust. That is pretty much how things work as shown below.


As you can see, the price of oil was very stable when we were on the pseudo Gold Standard. The data also shows dramatic instability during the fiat paper dollar standard (post-1971). Furthermore, in general, the price of oil moves roughly as Austrians would suggest, although monetary policy is not the sole determinant of oil prices, and obviously there is no stable numerical relationship between the two variables.

Another commodity that is noteworthy for its high price is gold. The price of gold also rises in the boom, and falls during the bust. However, since the last recession officially ended in 2009, the price of gold has actually doubled. The Fed’s zero interest rate policy has made the opportunity cost of gold extraordinarily low. The Fed’s massive monetary pumping has created an enormous upside in the price of gold. No surprise here.


Actually, commodity prices increased across the board. The Producer Price Index for commodities shows a similar pattern to oil and gold. The PPI-Commodities was more stable during the pseudo Gold Standard with more volatility during the post-1971 fiat paper standard. The index tends to spike before a recession and then recede during and after the recession. However, the PPI-Commodity Index has returned to all-time record levels.


High prices seem to be the norm. The US stock and bond markets are at, or near, all-time highs. Agricultural land in the US is at all time highs. The Contemporary Art market in New York is booming with record sales and high prices. The real estate markets in Manhattan and Washington, DC, are both at all-time highs as the Austrians would predict. That is, after all, where the money is being created, and the place where much of it is injected into the economy.

This doesn’t even consider what prices would be like if the Fed and world central banks had not acted as they did. Housing prices would be lower, commodity prices would be lower, CPI and PPI would be running negative. Low-income families would have seen a surge in their standard of living. Savers would get a decent return on their savings.

Of course, the stock market and the bond market would also see significantly lower prices. Bank stocks would collapse and the bad banks would close. Finance, hedge funds, and investment banks would have collapsed. Manhattan real estate would be in the tank. The market for fund managers, hedge fund operators, and bankers would evaporate.

In other words, what the Fed chose to do ended up making the rich, richer and the poor, poorer. If they had not embarked on the most extreme and unorthodox monetary policy in memory, the poor would have experienced a relative rise in their standard of living and the rich would have experienced a collective decrease in their standard of living.

There are other major reasons why consumer prices have not risen in tandem with the money supply in the dramatic fashion of oil, gold, stocks and bonds. It would seem that the inflationary and Keynesian policies followed by the US, Europe, China, and Japan have resulted in an economic and financial environment where bankers are afraid to lend, entrepreneurs are afraid to invest, and where everyone is afraid of the currencies with which they are forced to endure.

In other words, the reason why price inflation predictions failed to materialize is that Keynesian policy prescriptions like bailouts, stimulus packages, and massive monetary inflation have failed to work and have indeed helped wreck the economy.

(Update- Part 2 can be found here)

Health Insurance Premiums Set to Rise and the Absurdity of the CPI

The following article was written by the Wall Street Journal earlier in the week.

Health-insurance premiums have been rising—and consumers will experience another series of price shocks later this year when some see their premiums skyrocket thanks to the Affordable Care Act, aka ObamaCare.

The reason: The congressional Democrats who crafted the legislation ignored virtually every actuarial principle governing rational insurance pricing. Premiums will soon reflect that disregard—indeed, premiums are already reflecting it.

Central to ObamaCare are requirements that health insurers (1) accept everyone who applies (guaranteed issue), (2) cannot charge more based on serious medical conditions (modified community rating), and (3) include numerous coverage mandates that force insurance to pay for many often uncovered medical conditions.

Guaranteed issue incentivizes people to forgo buying a policy until they get sick and need coverage (and then drop the policy after they get well). While ObamaCare imposes a financial penalty—or is it a tax?—to discourage people from gaming the system, it is too low to be a real disincentive. The result will be insurance pools that are smaller and sicker, and therefore more expensive.

How do we know these requirements will have such a negative impact on premiums? Eight states—New Jersey, New York, Maine, New Hampshire, Washington, Kentucky, Vermont and Massachusetts—enacted guaranteed issue and community rating in the mid-1990s and wrecked their individual (i.e., non-group) health-insurance markets. Premiums increased so much that Kentucky largely repealed its law in 2000 and some of the other states eventually modified their community-rating provisions.


States won't experience equal increases in their premiums under ObamaCare. Ironically, citizens in states that have acted responsibly over the years by adhering to standard actuarial principles and limiting the (often politically motivated) mandates will see the biggest increases, because their premiums have typically been the lowest.

Many actuaries, such as those in the international consulting firm Oliver Wyman, are now predicting an average increase of roughly 50% in premiums for some in the individual market for the same coverage. But that is an average. Large employer groups will be less affected, at least initially, because the law grandfathers in employers that self-insure. Small employers will likely see a significant increase, though not as large as the individual market, which will be the hardest hit.

We compared the average premiums in states that already have ObamaCare-like provisions in their laws and found that consumers in New Jersey, New York and Vermont already pay well over twice what citizens in many other states pay. Consumers in Maine and Massachusetts aren't far behind. Those states will likely see a small increase.

By contrast, Arizona, Arkansas, Georgia, Idaho, Iowa, Kentucky, Missouri, Ohio, Oklahoma, Tennessee, Utah, Wyoming and Virginia will likely see the largest increases—somewhere between 65% and 100%. Another 18 states, including Texas and Michigan, could see their rates rise between 35% and 65%.

While ObamaCare won't take full effect until 2014, health-insurance premiums in the individual market are already rising, and not just because of routine increases in medical costs. Insurers are adjusting premiums now in anticipation of the guaranteed-issue and community-rating mandates starting next year. There are newly imposed mandates, such as the coverage for children up to age 26, and what qualifies as coverage is much more comprehensive and expensive. Consolidation in the hospital system has been accelerated by ObamaCare and its push for Accountable Care Organizations. This means insurers must negotiate in a less competitive hospital market.

Although President Obama repeatedly claimed that health-insurance premiums for a family would be $2,500 lower by the end of his first term, they are actually about $3,000 higher—a spread of about $5,500 per family.

Health insurers have been understandably reluctant to discuss the coming price hikes that are driven by the Affordable Care Act. Mark Bertolini, CEO of Aetna, the country's third-largest health insurer, broke the silence on Dec. 12. "We're going to see some markets go up by as much as 100%," he told the company's annual investor conference in New York City.
Insurers know that the Obama administration will denounce the premium increases as the result of greedy health insurers, greedy doctors, greedy somebody. The Department of Health and Human Services will likely begin to threaten, arm-twist or investigate health insurers in an effort to force them into keeping their premiums more in line with Democratic promises—just as HHS bureaucrats have already started doing when insurers want premium increases larger than 10%.

And that may work for a while. It certainly has in Massachusetts, where politicians, including then-Gov. Mitt Romney, made all the same cost-lowering promises about the state's 2006 prequel to ObamaCare that have yet to come true.

But unlike the federal government, health insurers can't run perpetual deficits. Something will have to give, which will likely open the door to making health insurance a public utility completely regulated by the government, or the left's real goal: a single-payer system.

Mr. Matthews is a resident scholar with the Institute for Policy Innovation in Dallas, Texas. Mr. Litow is a retired actuary and past chairman of the Social Insurance Public Finance Section of the Society of Actuaries.

So not only is a tax increase a done deal (and possibly more in pipe), but on top of that health care insurance premiums are set to rise by a wide margin.

I also mention this only because the the CPI was released today, showing no increase in seasonably adjusted inflation rates. The above should be taken into context that the CPI calculation suggests that health care spend is 0.656% of income or $656 per $100,000 annually. This is just an absurd input and makes absolutely no sense. It leads credence to those stating that the inflation rate is understated.

Economic Cycles Before the Fed

It is always a good idea to buff up in history.

Germany Wants its Gold Back

First, here is the Bundesbank offiicial statement.


By 2020, the Bundesbank intends to store half of Germany’s gold reserves in its own vaults in Germany. The other half will remain in storage at its partner central banks in New York and London. With this new storage plan, the Bundesbank is focusing on the two primary functions of the gold reserves: to build trust and confidence domestically, and the ability to exchange gold for foreign currencies at gold trading centres abroad within a short space of time.
The following table shows the current and the envisaged future allocation of Germany’s gold reserves across the various storage locations:

31 December 201231 December 2020
Frankfurt am Main31 %50 %
New York45 %37 %
London13 %13 %
Paris11 %0 %
To this end, the Bundesbank is planning a phased relocation of 300 tonnes of gold from New York to Frankfurt as well as an additional 374 tonnes from Paris to Frankfurt by 2020.
The withdrawal of the reserves from the storage location in Paris reflects the change in the framework conditions since the introduction of the euro. Given that France, like Germany, also has the euro as its national currency, the Bundesbank is no longer dependent on Paris as a financial centre in which to exchange gold for an international reserve currency should the need arise. As capacity has now become available in the Bundesbank’s own vaults in Germany, the gold stocks can now be relocated from Paris to Frankfurt.
....... while here are some comments, thoughts and otherwise on what this move could mean and its possible implications (source: CNBC.com)
News that Berlin wants to bring some of that gold back home is causing a stir, with Bill Gross, the managing director at bond giant PIMCO tweeting: "Report claims Germany moving gold from NY/Paris back to Frankfurt. Central banks don't trust each other?"

Ric Spooner, chief market analyst at CMC Markets in Sydney told CNBC Asia's "Squawk Box", "Whether or not their action really does reflect a lack of trust in the Fed (U.S. Federal Reserve) is a moot point, but it is certainly likely to be taken that way by some sectors of the market. The general inference is that if there was a real debt crisis in the U.S., then they (German authorities) would feel a little more confident about having their assets at home."

The U.S. fiscal woes are firmly in focus with Washington expected to reach its debt limit by the end of February. Finding long-term debt sustainability without hampering an economic recovery remains a challenge for policymakers, Fed chief Ben Bernanke said earlier this week.
 
"The reason the Bundesbank is doing this, repatriating the gold back home, is to instill confidence in the German consumer as to the solidity of the Bundesbank," Societe Generale's senior currency strategist Sebastien Galy told CNBC.

"Right now it is just a sign that the system is breaking down, that confidence is lower across the board and the entire financial system has basically become a domestic financial system, where you have the euro zone, a dollar zone and the yen zone," he added.

Dominic Schnider, global head of commodity research at UBS Wealth Management told CNBC, "Holding gold in key financial centers (New Tork, London or Paris) makes sense and can give access to foreign currencies like the U.S. dollar. On the other hand, we have seen how easy money printing is. Thus, we don't need gold anymore as collateral."
He added: "Nevertheless, holding some gold at home is not a bad idea in an age of ballooning central bank balance sheets. As a reference, Hong Kong also shipped its gold back home from London some years ago."
Analysts, however, did not expect any immediate reaction in gold or currency markets to any gold repatriation from the Bundesbank.
 
"For the gold market, it doesn't make any difference to the overall supply and demand situation. The Bundesbank is the owner of the gold regardless of where it's located," Spooner said.
For some analysts the question was not so much whether Germany would move its gold reserves, but whether it would sell the gold once it was back home.

"What Germany intends to do with its gold once it's repatriated would be interesting," said Nick Trevethan, senior commodities strategist at ANZ Research in Singapore. "We know that Venezuela sold some of its gold," he added, referring to a decision by Venezuela's government in 2011 to repatriate foreign bullion reserves from bank vaults in the West.

But despite all the theories about mutual central bank distrust and lack of faith in fiat currencies, or currencies that are not back by gold reserves, the Bundesbank's move - if push does come to a shove - may have a much more prosaic explanation: stock-taking. In October, Germany withdrew two-thirds of its gold holdings from the Bank of England, according to media reports and in the same month a German federal court said the Bundesbank could conduct annual audits and physically inspect its gold reserves worldwide. "Maybe it is triggered by a need to physically audit," David Kotok, chief investment officer at Cumberland Advisors said. "It is unusual so it triggers speculation about the motive. It may also be benign and markets just accept it."

There's some substance in this. Germany's international broadcaster Deutsche Welle reported on its website on Tuesday that the Bundesbank is reacting to a recent report by the Federal Audit Office which has criticized the lender for failing to thoroughly check the amount and authenticity of the bullion stored abroad,.

I would not be surprised if this does not became a trend and countries/central banks/large multi-nationals further consolidate and secure access to all resources, not just gold.

James Grant Interview from Bubble

The raw James Grant interview from Bubble

Too Much on The Central Banks- FT

I think this is a must read.

By John Plender
Unconventional measures turned 2012 into a dash for trash
The search for yield turned 2012 into a veritable dash for trash in global markets. The lower the credit quality, the better the performance was the guiding principle, with poor quality credit outperforming investment-grade credit. At the same time, credit securities more generally tended to outperform government bonds and equities.

With the notable exception of Japan, it was a triumphant year for the central banks, whose unconventional measures to secure ever looser monetary conditions worked a remarkable spell on global markets. In the first two weeks of 2013 it has been more of the same as risk appetite remains rampant across the world. The sense of déjà vu is palpable and points to a serious vulnerability. In many parts of the market credit spreads are now nearly back to pre-crisis lows. As the Institute of International Finance points out in its latest Capital Markets Monitor, bonds with relaxed credit discipline are back. Among them are instruments such as “payment in kind”, a particularly hairy product of the credit bubble, while the issuance of covenant-lite loans is now above its previous record level set in 2007.

In the meantime, all manner of seemingly anomalous valuations are to be found across markets.
The fact that dividend yields on many very stable big companies are higher than the yield on their corporate bonds has been widely noted. In the UK, it is possible to buy index-linked property leases in food retailing on a similar yield to that on related corporate bonds on which the income is fixed. The nature of a market driven by central bank liquidity is that momentum triumphs over fundamentals. Anomalies are thus to be expected, but are hard to exploit when the authorities are firmly committed to continuing market manipulation.

That does not necessarily mean that there is no case for switching from credit into equities in the short term. Yet it is important to recognise that what central banks give can equally be taken away, a point that applies particularly to the US Federal Reserve. This is partly because the Fed has been the driving force behind global markets over the past 12 months. The clearest evidence for this comes from the relative performance of developed world economies and emerging markets.

While emerging market economies were harder hit at the start of the crisis they very quickly exceeded previous peak levels. By contrast, the big developed economies, with the exception of the US, are still not back to their previous peaks. Yet emerging market equities have not followed the stellar performance of their underlying economies back to pre-crisis levels. They have simply tracked the developed markets, which remain below their previous peak.

The other concern for equities is the marked polarisation in the developed world between the US and the rest. The US is more advanced in its deleveraging process. Its banking system is now better capitalised than that of Europe. The housing market is on the turn. With fiscal concerns showing the potential to become more manageable, the likelihood of some of the non-financial corporate sector’s near-$1.4tn nest egg finding its way into increased investment is growing. So if unemployment comes down faster than expected, the markets will become increasingly preoccupied with an early retreat by the Fed from quantitative easing.
Nobody can be entirely certain how much the rise in equity prices owes to these liquidity injections. Last year’s analysis by the Bank of England of the macroeconomic impact of its gilt buying programme between March 2009 and May 2012 for the Treasury select committee nonetheless provides clues.

Using the Bank’s numbers, the independent pension consultant John Ralfe estimates the great majority of the increase in the FTSE 100 index since the start of that period is a result of QE. There must be a chance that any retreat from QE in the US would thus have a pretty significant impact on equities, as well as on overblown government debt and corporate credit markets. The US economy is probably now sufficiently robust to weather any resulting storm, even if the financial system retains its capacity to spring nasty surprises. The same can hardly be said of Europe. The European Central Bank would not find it easy to offset the market impact of the Fed in tightening mode. And investors would inevitably refocus on Europe’s underlying structural weaknesses, along with unresolved faultlines in the monetary union.
In the enduring risk-on/risk-off game that has prevailed since the crisis began, the scope for a juddering reversion to risk-off is painfully clear.

The key message for markets in the year ahead is that the central banks will once again call the shots. Much – almost certainly too much – is riding on their ability to steer a stable course back to normality.

Tuesday, January 15, 2013

High Volume Highs for 1/15/13 Trading Day

A few good names to choose from in the new high volume highs. First there is SNTS, whose shares increased on a drug approval and improved guidance. ENOC shares rallied more in relief that EPA rule governing diesel motors was less onerous than expected. Last, we have BGFV, up on the release of preliminary quarterly results that were apparently better than expected.


The Yen and Japan's Inflation Targeting- O'Neill

Some really interesting developments in the Japanese economy and growing loss of independence of the Japanese Central Bank. A part of me wonders if the move is not setting up for a long trade in the Yen, although I would not venture to do that now.

Volume Off the High for 1/15/13 Trading Day

Just one name on the list today. SUNS is down after announcing a secondary offering of stock.


What are Hedge Funds Doing with Gold

Regardless of what the talking heads are saying, and remember they mat be right, I would still wait for the sign of strength in gold before committing funds. It is a lower risk strategy and you have a higher probability of avoiding trying to catch the falling knife.


There just is no sign of strength here yet. Volume has been weak to the upside recently as the price of the GLD trades into the mid-December downdraft.


Cause & Effect- Another Great Santelli Rant

Santelli is, in my opinion, one of the only reasons to watch CNBC. Over and above seeing where futures are trading at 4 a.m. when I first wake up.

The Demise of the $Trillion Dollar Coin

Now that platinum coin rhetoric has been called out as BS, Political Calculations is/was out with a great piece playing with the math involved with platinum. The article reads, in part....

Using the spot price for platinum of $1,629 per ounce at the close of business on 11 January 2013, we estimate that it would take just over 613,873,542 ounces of platinum to make the coin, which works out to be about 38,367,096.4 pounds, or a bit over 19,183.5 tons.

That seems like a lot, but physically, that much platinum would only occupy almost 21,427 cubic feet of space, just enough to fit inside this modest home design of "rare beauty".

Now, here's where it gets interesting, because all the platinum that has ever been mined on Earth would fit in a room that's just 25 cubic feet in volume. That would leave the U.S. Mint about 21,402 cubic feet of platinum short of what would be needed to do the job properly.

This got me thinking about the unstated questions never addresses. First and foremost, would not the discrepancy between the available supply and potential demand that could be derived if the metal was used as a medium exchange (here only using $1 trillion as a base vs. an estimated world economy producing over $50 trillion and debt estimated to be over $150 trillion) force the price upward? In my mind the answer is yes. However, the amount of any potential rise in this scenario is uncertain, as a discount factor would likely be employed to account for annualized turnover.

It also got me think thinking about gold, as gold is the historic, barbaric metal of monetary. And yes, the same dynamics are out play. Assuming a $1,600 per ounce price in gold, all the gold ever mined would amount to just $8 trillion in value. See my previous post on All the Word's Gold.

All The World's Gold

Infographic porn for gold bugs and investors.

All The World's Gold
From: Number Sleuth

Giant Squid Caught on Film

The video of the squid is amazing. The absolute mindless banter of the ABC broadcasters, not so much. I would watch this on mute.


Apple's Shares Break Support on Elevated Volume, Next Stop

I guess the market is ignoring semi-positive comments from the Sterne Agee analyst who states....

Shaw Wu at Sterne Agee says weak demand is not a problem for Apple. In a new note he says, "As far as we can tell, iPhone 5 demand remains robust." He explains the cuts in orders as such: "(1) much improved yields meaning lower component builds and (2) supplier shifts."

Regardless of the bull or bear thinking on Apple's prospects, the market has spoken and investors are selling the shares. Today's sell off not only breaks the $500 price point, which will probably be touted as a major occurrence, thus creating a negative psychological feedback, but more importantly the stock broke the February 15th high volume resistance level. This is seen in the below chart.


Today's decline is on somewhat elevated volume. The break of the resistance puts into play the price gap to the $420 price point.

High Volume high/Volume Off tHe high for 1/14/13 Trading Day

Took some time off yesterday, as I was a little under the weather. In any event there was no stock or fund that made the final cut to be volume off the high. As for new high volume highs, three names made the list. First there is Flower Foods, up on the news that it is buying brands from the defunct Hostess. Then there is CLSN, a biotech whose stock is up apparently on positive results from a drug in Phase III trials. Last, there is HTHT, a Chinese hotel concern. The stock is up on no direct news, but it may be gaining strength on a better economic outlook for China.


Sunday, January 13, 2013

Long-term Value Porfolio Update for Week Ending 1/11/13

For the most recent week, the Long-term Value Portfolio lost 50 basis points of value or 90 basis points relative to the market over the same time period, as the S&P 500 gained nearly 40 basis points (bps). Year-to-date, the portfolio remains in the positive column with a 3.3 percentage point gain or just over the market's gain of 3.2%. Since inception, the portfolio have gained 10.5% or 240 bps better than the market over the same comparable time period. This can seen in the chart below showing the portfolio (blue line) the S&P 500 (green) and the NASDAQ (brown)

The loss on the week came primarily from underperformance of names in the consumer staples, energy, and materials sectors only partially offset by gains in financial, healthcare and telecom stocks.

VIX-Trading Portfolio Strategy Update for Week Ending 1/11/13

The VIX-Trading Portfolio had a decent performance week, gaining more than 2 percentage points of value or 1.7 points relative to S&P 500's gain of nearly 40 basis points. That said, the portfolio remains in the negative on a year-to-date basis and since inception on both an absolute and relative basis. The reasoning behind this underperformance was the short investment stance running up into the "resolution" of the fiscal cliff talks and the subsequent strong market performance. This performance characteristic is seen in the chart below with the blue line being the portfolio and the green and brown being the S&P 500 and NASDAQ, respectively.


The portfolio remains invested in the 2x S&P 500 Return ETF, as the standardized VIX data points towards a more bullish stance. Now one thing I have to admit is that the VIX-Trading Portfolio is less of a strategy and is more of a real-time experiment using the VIX data to gauge entry and exit points into the market. If and when I get more comfortable with the results using the data, I will begin to migrate the use of the signals into my portfolios and other trading/investing strategies. This is very much a work-in-progress. 

To that end, I wanted to provide an update on the latest models historic performance characteristics, which I show graphically below.


The pink line above represents the performance of the black-box VIX-Trading Strategy. This model goes long the 2x long S&P 500 ETF following periods when the mode gives a buy signal and the 1x short S&P 500 ETF when it flashes a sell signal. The model passively accepts the market's return in all other cases. One word of caution, this model only represents past performance characteristics in the historical context. This is not to suggest that I will use any signal as solely as a black box nor would I suggest anyone do the same. I intend to use the signals in conjunction with other technical and fundamental measures to make trading calls that may or may be biased by the VIX model. If it is one thing I learned over the years is that any working investing model can and will fail at times and just passively accepting any signal from any model can result in significant underperformance.

Short-Trading Portfolio Update for the Week Ending 1/11/13

So far in 2013, the Short-Trading Portfolio has underperformed the market by 630 basis points (bps) and has declined by more than 3 percentage points since the turn of the year. Since inception,is showing a slight loss of -.02% or 210 basis points relative to the market over the same time period. The below chart shows this portfolio dynamic with the blue being the portfolio and the green and brown representing the S&P 500 and NASDAQ, respectively.


Most of the losses have occurred in the market run up following the fiscal cliff "resolution". However, I would note that the latest week's performance added to the recent losses, with the portfolio losing 70 basis points in value of 110 basis points relative to the market.

Long Trading Portfolio Update for Week Ending 1/11/13

The Long Trading Portfolio- which as a reminder tracks any long ideas I may post and suggest on this site- took on the chin this week. This can be seen in the below chart, tracking the performance of the portfolio (blue line) the S&P 500 (green) and the NASDAQ (brown).

For the latest week, the portfolio declined by more than 5 percentage points, as the coal companies (both Arch Coal and Alpha Natural) took it on the chin. On a relative basis, it underperformed the S&P 500 by a wide margin, as the market gained nearly 40 basis points (bps). Since inception, the portfolio's performance remains positive with a gain of 10.2%, or 8.1% relative to the market, but is down relative to the market by 590 bps so far this year.