Friday, June 21, 2013

Meet the Economists Who Have Explained Every Crisis Of the Last Century (No, Krugman Isn't One Of Them)


Many people still believe the economic mess we wallow in was either unpredictable or caused by massive deregulation — despite the fact that government activity never really decreased. Both assertions are false. Every single economic crisis of the past 100 years was predictable (and sometimes predicted) and caused by government intervention in the economy.

In fact, it seems some people in 2013 have started realizing it. Dr. Emanuele Canegrati, senior economist for the Italian Parliament, even went on to say that Ludwig Von Mises, late Austrian-born U.S. economist, and his Austrian School of economics were right with their theories on economic cycles and inflation.

meet, the, economists, who, have, explained, every, crisis, of, the, last, century, (no,, krugman, isnt, one, of, them), What is this theory? Despite what Keynesians like Paul Krugman claim, Austrian economics is not a cult. It is a serious science based on praxeology, or the study of human action and choice. Unlike atoms or animals in laboratories, it is nearly impossible to study the actions of humans in an experimental setting, since it is nearly impossible to have ceteris paribus (everything else remaining equal) conditions.

  Therefore, praxeology can only analyze the effects, not the motivations, of human behavior. Nonetheless, it goes a long way toward explaining the theories of Austrian economics.

For example, on a personal level, Mises said in Socialism, An Economic and Sociological Analysis that if we consider alcohol or other drugs to be dangerous, we won't use them. And if we think it's detrimental to others, we can only try to convince them it's not good for them because “in a capitalist society, whose basic principle is the self-determination and self-responsibility of each individual, [no one can] force them against their will to renounce alcohol.” If that's their way to happiness, so be it.

With respect to economics, praxeology tells us about the sustainable ways to get rich, mainly with a sound monetary system (based on a commodity like gold or silver, which is rare and hard to reproduce) and banks whose only regulation is to respect their contractual obligations, meaning they must be able to get their customers all their money at any given time (i.e. have all the deposits as reserves). Even monetarists like Milton Friedman agree with that.

With that in mind, one can easily see what lead to the 2008 economic crisis and what kept the economy from totally recovering. Ours in a fiat monetary system. Otherwise useless pieces of paper become “legal tender” because the government and/or the central bank says it is worth so much. Since fiat currency isn't tied to any commodity, nothing keeps the creators of the money from printing as much as they want, which happened with the infamous quantitative easing (QE) program. Printing money keeps the interest rates low, meaning businesses have an incentive to get loans and create jobs.

Unfortunately, this easy-money policy isn't sustainable at all. Loans are supposed to be backed up by savings, not by money created out of thin air. Such money, as economists Richard Cantillon, Jean-Baptiste Say, Adam Smith, Murray Rothbard, and so many others have noticed, ends up lowering the value of currency, requiring more bank notes to buy the same products. This is inflation, and this is what destroyed the economies of so many countries in the past. In short, either the economy collapses because money has become worthless, or the central bank stops the printing press, which causes a recession/depression (the longer the period of easy money, the more severe the ensuing crisis).

Now, depressions in themselves are vital. They are an occasion for the economy to rejuvenate and purge itself of its unsustainable elements created by cheap money. It worked fine in 1920 with Harding. But the 2008 depression hasn't been able to rejuvenate at all, since successive governments have voted to bail out incompetent businesses, like GM and Chrysler, that haven't been able to keep up with demand.

Banks have also been bailed out with our tax money. While their actions were indeed despicable — loaning to people who had very little potential of paying back — those actions can be explained with praxeology. Normally, a bank operates to make a profit out of a service it offers to others. It loans money (if it decides to do so) with the appropriate interest rate, according to what the bank believes is the default risk of the borrower. A few borrowers defaulting can happen, but nothing to cause a bank run where everyone wants their money back before there is none left.

However, with modern banking regulations, banks have lost the incentive to act responsibly. Thus, regulations such as the Equal Credit Opportunity, which forbids banks to ask questions about marital status or source of revenues, the Community Reinvestment Act, forcing banks to make loans to poorer families, Fannie Mae, which increased mortgage loans to lower-income families, and the Federal Deposit Insurance Corporation, which ensures that most deposits under $250,000 are safe from banking failures, have all encouraged banks to act for their better interest, i.e. recklessly. When the interest rates were (artificially) low, as they were under George W Bush and as they are right now, control can be maintained. However, as soon as the interest rates increase, defaults increase, and the Ponzi scheme (in this case, the bank claiming to have more money than it really has) collapses, as it did in 2008.

So what could be done to solve the present economic woes? Just what the Austrians suggest we do: Stop cheap money (which ultimately means abolishing the Fed and going back on the gold/silver standard), stop government distortions of the market, and let people act according to their self-interest as long as they don't endanger others' lives or property. There is no other way around it.

S&P 500 Price/Volume Heat Map for 6/20 Trading Day

A little different format today for the price/volume heat map (I am on a computer I do not normally use). In any event, there is a lot of 'red' on the map due to the heavy, supply driven sell off. The selling was rather broad based across the sector groups, with telecom being the least affected by the run.


The heat map fully reflects the supply-side selling in yesterday's market action. Most the stocks in the S&P 500 sold off on heavier volume levels. The best performing sector group on a price/volume basis appears to be the financials.


Q.E. Infinity and Beyond!

The commentator in the clip below has not done his homework.


Wow, Dow 20,00 is a little bold and probably completely ignorant of the effects QE. Further still, profit margins are running 70% above normal because of the low saving rate in the government and household sectors. This, at some point, will end, and profit margins will come tumbling down with the reversion. Hence the measures cited, like PE and ROE, have no real bearing as point of comparison versus past time period. Just see the analysis from John Hussman below. It should go without saying I side with Schiff in the analysis.

The facts that savings equal investment and that the deficits of one sector must arise as the surplus of another are not theories. They are identities that must hold true by accounting definition. It does not matter how companies are deriving their profits (domestically or internationally). It does not matter how consumers are obtaining their goods (domestically or internationally). It does not matter how the government is financing its deficits (domestically or internationally). It is true merely and strictly by identity that savings equal investment, and that the deficits of one sector must arise as the surplus of another.

The exact way that this comes about is up for grabs, but the end result is not. It is also true empirically in decades of data since the 1940’s that the following aspect of that relationship holds quite robustly: variations in profit margins are essentially a mirror-image of the combined deficit of households and government. This is true not only of levels, but of point-to-point changes.

Corporate profit margins will contract as the combined deficit of households and government retreats (even moderately) from the record levels of recent years. The impression that stocks are “reasonably valued” relative to earnings is an illusion driven by profit margins that are 70% above their historical norm.

Gold Testing $1,000....

I never really considered myself a snake-oil salesman, but oh well.


Video after the jump

Where Will Gold Bottom,,,,

Short answer is I do not know. Before yesterday, I had thought gold and the precious metal stocks were trying to form base. My longer answer is that yesterday's price/volume action puts the $1,200 range in play. This the last price support area where volume demand drove prices higher. Just look at the long-term chart of the GLD, to get a sense of this support region.


And yes, my view is biased, as I have been buying since about the $1,400 level and would continue to do so. I would much rather own gold and/or precious metal stocks at these levels versus say equities or bonds in a long-term time frame. Remember, gold has not had a a correction in years. This downdraft is trying to correct that error. That said, with the prospect of world-wide money printing by central banks, gold prices are going much higher in the long-term.


60/20 Trading Edition of Volume Off the High

Somewhat of an expansion, but the initial screening list was huge.


6/20 Trading Day Edition of High Volume High.. Gold and Rates

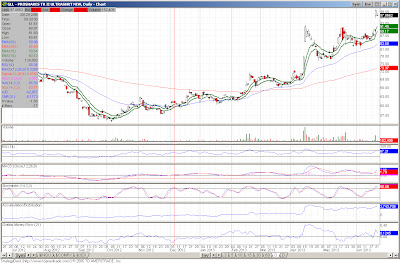
A couple interesting new highs in yesterday's trading, first and somewhat unsurprisingly the GLL or the Ultrashort Gold ETF traded to a new high on higher volume, as gold sold sold off. This could suggest more pain in the gold trade. And yes, I say that heavy-hearted as I remain long the gold/gold metal stocks. More interesting, the TBT or the short 20-year treasury bond fund traded to new, near-term highs on volume. Additionally, the TBT broke the apparent resistance around the $70 level. This is important as the price of the TBT usually move in tandem with long-bond rates, meaning that as equities were being sold so were treasury bonds.


A Quick Note on All That Glitters

Obviously, to my own detriment, the gold/precious stock timing models have not been working as I originally intended in the current downdraft. I have a sneaking suspicion as to why, but that will take some testing to see if my thoughts are correct. With that, I intend to provide this week's "All That Glitters" post with little comment.

That said, I have a good idea where the models will come out this week (i.e. moving back into a stronger buy area). I remain a long-term bull in gold and gold stocks and think that continued money printing world-wide will lead to increased volatility in the fiat monetary regimes, thus providing support for hard-money assets. 

Mr Bernanke- What Are You Afraid Of- Schiff and Santelli

Schiff interviews Rick Santelli. Probably the smartest seven and three quarters minutes you will take today.

Thursday, June 20, 2013

Fed Is Trying to Reflate a Phony Economy

More discussion here on the effects of rising mortgage and housing.......

Housing Recovery is Precarious- Shilling

And here is another reason why the Fed will taper the taper talk.It has been my conjecture that a large part of the housing recovery, albeit real, has been nonetheless predicated on investment sales. What do you think would happen to real estate prices if a decline in cap rates drives investors to sell their holdings. That, of course, may be an exaggeration, but at the very least a decline in cap rates would drive out the 'marginal buyer'.


The video can be found here.

The Fed Will Taper the Taper Talk- Schiff

I wholly agree with the belief that the Fed will not taper QE, the negative market's action following the announcement that Bernanke et. al. will be taking away the monetary drugs sooner rather than later is just one reason why.....

S&P 500 Price/Volume Heat Map for 6/19 Trading Day- Federeal Reserve Edition

Following the Fed announcement, where Bernanke et. al. maintained the $85 billion a month in bond buying but suggested an end to stimulus in 2014 or earlier, ahead of expectations, the market sold off significantly. Additionally and probably more importantly, Bernanke stated they have moved the goalposts to a 7% unemployment rate as the threshold to when they end or taper QE actions. On this news, the S&P 500 lost about 140 basis points in value in yesterday's trading on losses across all sectors. That said, the weakness appeared focuses on the less cyclical sectors.


The price/volume heat map reflects the price dynamics. The red areas of the map- those stocks showing the highest degree of higher volume price declines on higher supply and/or price increases with little volume support- were concentrated in the non-cyclicals. Below the heat map, I show the same data in a different format. This second chart shows the percentage of stocks in sector groups experiencing either strong upswings (++) or large sell offs (--) with volume support. Additionally, the chart shows more benign price/volume gainers (+) and losers (-) along with stocks exhibiting mixed signals (0). One can see the large percentage of names in the '--'  category across all sectors, meaning the sell off in those names came with increasing supply. I do find it interesting that both the heat map and the percentage break down charts show signs of relative strength in the materials, technology, and discretionary sectors.


6/19 Trading Day Edition of High Volume High

A contraction in the investment choices here with the market sell off....


6/19 Trading Day Edition of Volume Off the High

i would half expect an expansion coming off of today's trading. In any event, we saw an increase in the number of stocks and funds in yesterday's trading with the market sell off.


Wednesday, June 19, 2013

What Is Bernanke So Afraid Of?- Santelli

More than a few are looking at the hinted departure of Bernanke as a sign of things to come. Best quote- "they take a press release from the Fed and they think it was written by God."

The Next 18 months Will Redefine Japan and The Economic Orthodoxy of the West- Kyle Bass

The presentation is about an hour long (so block off some time), but it is well worth it.

FOMC Scenarios- What Is Priced In.

This comes via Zero Hedge, the rest of article can be found here. Charts and comments are the opinion of BofAML


As important as when the Fed might taper its asset purchases is why it might do so. Uncertainty about the Fed’s QE reaction function, BofAML argues, is a significant contributor to recent market volatility. There are several scenarios that could explain why a number of Fed officials have started talking about tapering: they have become more optimistic on the outlook; they are more worried about potential QE costs; they have decided to taper earlier for largely technical reasons. The first of these likely would be the least disruptive for markets, and the last the most. Clear Fed communication could mitigate some of the volatility, but, as BofAML notes, the current lack of consensus on the FOMC likely means uncertainty will likely persist.

Via BofAML,

The good news taper

Several Fed officials have sounded more optimistic on the outlook recently, including noted doves (and current voters) Charles Evans (Chicago) and Eric Rosengren (Boston). Other core Fed officials, such as Chairman Bernanke and New York’s Bill Dudley, sound less convinced in recent remarks and seem to have reluctantly acknowledged that tapering before long is not outside the realm of possibility. If we get a sustainable improvement in the job market data and inflation converging back toward target, that outcome should leave the markets relatively comfortable with the Fed beginning to modestly pull back its accommodation. In that case, markets should be able to transition from Fed-led liquidity support to a better growth-led recovery story.

The bad news taper

The ride could be bumpier if markets conclude the Fed has grown more concerned about QE costs and is ending QE prematurely. We don’t see these concerns motivating the voting majority to taper early: Bernanke and Dudley, for example, admitted to monitoring for financial instability but concluded that the benefits of continued QE outweigh the costs. For some market participants, the current talk of tapering is at odds with the still weak outlook, leading them to conclude that the Fed isn’t acknowledging its true degree of concern over QE costs. Others disagree with the Fed’s current assessment of risks, and expect the Fed will eventually have to tighten policy much sooner than they have indicated. In either case, the process will be more volatile: tapering seen as premature is likely to spur risk-off behavior and increases the odds that the Fed will eventually decide to scale back up their purchases should the data worsen.

The not-so-timely technical taper

A view gaining some traction is that the Fed is discussing tapering because it actually has a lower threshold than indicated, perhaps for some technical reason. There are several variations to this view: the Fed wants to introduce volatility; it wants to “send a message” to the markets; it wants to test a small taper to see the response. Such scenarios would be quite tricky for market participants: they not only fail to clearly identify the Fed’s longer-term reaction function, but also presume the Fed, in part, is hiding its true motives.
The Fed does not typically work this way - not only do these stories run counter to the greater transparency under Bernanke, but they tend to undermine the Fed’s ability to satisfy its dual mandate. Thus our temptation is to fade these stories, but we cannot completely rule out some kind of early, small, technical adjustment to QE. The Fed is limited by a lack of consensus over QE, but they arguably could clarify their reaction function better than they have to date.

S&P 500 Price/Volume Heat Map- 6/18 Trading Day Edition

The S&P 500 traded up yesterday, gaining 80 basis points in value. Looking at the sector performance, most sector's gained in value with outsized gains in discretionary, industrial, and telecom stocks with the later two sector essentially leading the market higher.


The price/volume heat map reflected the price gains to a certain extent. On a percentage basis, telecom was the strongest performer with nearly 60% of the stocks in the sector trading up with high volume support. The remainder of the sectors exhibited price gainers with high volume support amounting to about 50% or less of the stocks in group. It is my opinion that the price/volume heat map does not necessarily support the strong price gains in yesterday's market action.


6/18 Trading Day Edition of High Volume High

More than a few names in yesterday's trading making new, near-term highs with volume support. A couple furniture makers either making the list are seeing expanding prices (but not new highs) on volume.


6/18 Trading Day Edition of Volume Off the High

Just a few names with the market up in yesterday's trading.


Tuesday, June 18, 2013

Thank Goodness For Gold's Correction- Rogers Is Buying Gold

This represents a change in his investment stance. So does this suggest a bottom? I would not be so audacious as to make that claim (and neither would Rogers), but this is an interesting turn.

Best Paragraph You Will Read All Day

Zerohedge's Tyler Durden is out with one of the best paragraphs you will read all day knocking the NSA, Obama, the U.S. spying on its own citizens, HFT, market micro-structures, gun control and the like.

To think it only took the world's most (in)famous whistleblower to get the NSA to disclose that it had heroically managed to prevent terrorist attacks involving the New York Stock Exchange (we supposed they refer to the Manhattan-based TV studio and not the actual exchange where the servers are now housed in Mahwah, NJ) and the NY Subway. Because whereas there was a time in the past when the various US secret services would scurry at the opportunity to disclose their expertise to the general public, now it is a false negative that is supposed to disprove a positive (pervasive spying on the US population is good for you because...). Of course it takes one non-false positive to disprove a false negative, namely the Boston Bombers, who as far as we recall, used cell phones to communicate. But so much for details: now please praise the NSA, and also comply with the Administration's push to rescind the second amendment. Or is Obama no longer pushing for "arms control"?

Cash Balances, Stock Buybacks, and Equity Performance

As a follow up to my previous post on the equity performance of stocks for companies with high cash balances, I thought it would interesting to also look at how some of this cash (or in some instances the lack there of) is deployed. Specifically, I am looking at share buybacks. I believe it is fairly well known that equity performance following share buybacks is everything but stellar, as corporate managers are neither adept or consistent market timers. But hey, who is?

To that end, the below chart shows the the average equity performance of stocks following large buybacks (defined as 1% or greater of shares outstanding).


The equity performance of shares following buybacks has, on average, slightly underperformed the market over the time period looked at. Not a great indication of the apparent value of share buybacks.

To refresh your memory, the following chart shows the average performance for the stocks with companies having high cash balances (defined as cash per share greater than 25% of the share price). For comparisons sake, I have also included the performance for share buyback companies.


Again, not a rousing confirmation that stock buybacks are of any incremental value to shareholders.

This got me thinking, what would the average performance be for companies in the S&P 500 who had high cash balances and did not buyback a significant amount of shares. In a nutshell, even better.


What about companies that have high cash balances and also buyback a significant number of shares? As the chart below shows, the performance is just abysmal.


The moral of the story is be careful with stocks that buyback shares, and cash may not necessarily be trash.