Friday, May 31, 2013

The Price/Volume Heat Map.

This is something I am looking at in my free time. I am still working out the kinks and how I want to present it, but I thought this was a decent first draft. This comes from my belief that the stock market heatmaps are useful tools that display a lot of information in an easy infographic. However, I have always found the heatmaps use of just the price change as a major shortcoming.

To correct for this, I created the below heatmap including volume changes. More specifically, the relative strength in volume. Dark blue and blue indicate price and volume strength while red and dark red indicate weakness. White indicates relatively no change.

The chart is for the 5/30 trading day.


The Error of Central Bank Is Univeral- Stockman

A great interview of David Stockman by Rick Santelli. A side note, I bought The Great Deformation over the weekend, and i am looking forward to reading it. It may take me awhile, but I will provide a review when I am done.

So Where Are We Now in This Market?

Soros Supposedly Buying Gold Aggressively

If he is not, the analysis presented is interesting none-the-same.

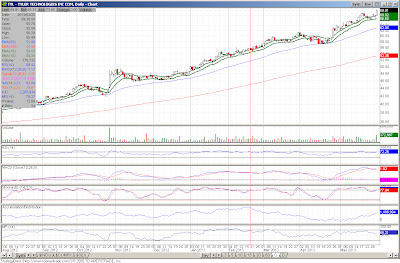
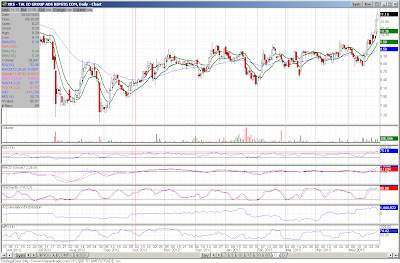
5/30 Trading Day Edition of Volume Off the High

Despite a lack of follow through on the Gold Trust ETF (ticker GLD), we saw a some heavy volume coming out of DUST or Direxion Gold Miners 3x Bear ETF. Although the volume of the upside on the GLD was weaker, and I should note the upside move was tepid, the gold miners (ticker: GDX and GLDX) both had decent moves with decent volumes. Something to be mindful of especially if you are bullish gold or the miners..... hey like me.


Life at the Bottom of Sea

Life is just amazing....

5/30 Trading Edition Day of High Volume High

More than a few names on the list in yesterday's trading


Thursday, May 30, 2013

OECD Warns of the Risks from QE Exit

The Organization has warned in its semi-annually report that the exit from quantitative easing programs may be painful. As the report states.......

“Exit from unconventional monetary policy, when needed, may be difficult to manage and less smooth than desirable, possibly leading to sharp rises in bond yields and serious negative consequences for growth in a number of advanced and emerging economies,” Pier Carlo Padoan, OECD’s deputy secretary-general and chief economist, said in the report.

further still

“A leap in U.S. government bond yields would result in capital losses for investors, and prices on other assets would most likely follow suit, with mortgage-backed securities and corporate bonds most strongly affected,” the OECD said in its report.

“In comparison with 1994, this could be more disruptive given the current higher leverage in the U.S. economy and financial system. Unless offset by portfolio shifts as investors move funds from bonds to equities, the higher long-term interest rate would weigh on equities and property valuations could also be marked lower.”

Oh really, you think this experimental in monetary policy where nearly all major central banks are printing money will end with at least extreme economic volatility? All one has to do is look at the the liquidity preference relationship (eloquently described by John Hussman and others) between T-Bills, GDP, and monetary base to know that the exit will be messy.

Chart via Hussman Funds.


At current liquidity preference levels, it will not take much of dislocation or change in GDP or interest rates to make the unexpected painfully clear.

Gold, Liquidation And The Dollar- BCA Underweighht Gold

I am posting with notion of showing and highlighting aspects of where I can be wrong in my own gold (long-term) bullishness.

We continue to recommend underweight positions in precious metals within the commodity complex.
Gold, Liquidation And The Dollar
Speculators are still net long gold futures and gold ETF liquidation continues. These shifts are no longer at an early stage, and the “panic lows” of last month have survived their first test. Still, the combination of a rising dollar and firm global bond yields is not friendly to gold (and silver).

The multi-decade relationship between the U.S. equity risk premium and gold prices points to further headwinds and reduced demand for “safe havens” like gold. The dollar outlook is complex, but what is clear is that the trade-weighted dollar has risen above the 84 level that offered resistance in mid-2012. An extension of the current deflation scare would likely keep gold under pressure, given the Federal Reserve’s reluctance to extend quantitative easing any longer than absolutely necessary.

Overall, our recommendation to avoid bottom fishing gold and silver remains intact. Gold would stabilize in the $1300-1400/ounce zone if the dollar bottoms out.

Why Conservation Does Not Work- The Tragedy of the Bunnies

The game is found here after the jump


What the Health-Care Law Will Cost Small Businesses

Although the WSJ tries to paint  a pretty picture, I was watching and just saw the drain of dollars circling as wealth exists the economy.

5/29 Trading Day Edition of Volume Off the High- 'The Homebuilder and REIT Files'

A significant number of homebuilder and REITS fell from highs in yesterday's trading. This is an interesting dynamic considering the divergence with he price of lumber, albeit a divergence that could be explained by supply issues with lumber production, but still interesting.


5/29 Trading Day Edition of High Volume High- The Death 'Issue'

A decent number of names here. A number of the death service providers are on the list with Service Corp (ticker: SCI) announcing the buyout of Stewart Enterprises. It has been a long while since I have looked at the death service providers (I did make a lot of money on SCI a number of years back), as I got disenchanted with the slow growth nature of the business in conjunction with what I would call negative governance issues. At first blush, the purchase of Stewart by SCI would seem to confirm the environment is still slow growth.


Wednesday, May 29, 2013

Lumber Still Down, Homebuilders Still Up


I wonder if the relationship that has seemed to hold will reassert itself. And if you are asking the question, I am contemplating taking the short side on the homebuilders here.

a 3-year chart.


Or a longer-term perspective


Just an FYI, the contract volume on the lumber futures have been accelerating on the downside. Someone whats out of their positions.