Friday, August 3, 2012

Technical view of the GDX

I previously posted an update on the trend of the XAU and the standard deviation of the price of gold relative to money supply.. pasted below
----------------------------------------------------------------------------------------------------------
Either way, I thought it would conducive to update my gold stock timing indicator. This indicator compares the price of the Phily Gold/Silver Sector Index (ticker XAU) to the the standard deviation of the price of gold relative to money supply. Historically, buying opportunities on the XAU (and precious metal stocks in general) present themselves when the standard deviation falls below -1.  The below tables show the performance averages of the XUA over a one week period, three months, six months, one year, and two years since 1981.


On average, the performance in subsequent periods following a standard deviation of the price of gold relative to money supply of -1 and -2  far surpasses the respective average buy-and-hold performance. The performance figures appear robust. Just look at the minimum performance seen across all periods. Buying precious metal stocks when the standard deviation falls below -1 reduces your downside potential, at least in a historical context. In addition, the Sharpe ratios (average return divided by standard deviation of the returns) is much improved across all time periods. Here is the data represented graphically.

 The current standard deviation is -1.12.
--------------------------------------------------------------------------------------------------------

I have been looking at the price chart of the Market Vectors Gold Miner ETF (ticker GDX) and thought I would update you on what appears to be an interesting set up (full disclosure- I own gold stocks through various mutual funds).

On a long-term basis, the GDX has tested the 2010 lows twice, and despite high volume could not punch through this resistance.


Looking at the yearly chart, you will see flag pattern of higher lows and lower highs since May, indicating the GDX is in a period of consolidation before the next move. And where is the next move heading. I think the recent price performance is telling. Look at the price performance on 8/1. On that day, the GDX changed hands to the tune of 30.7 million shares and was lower on the day. However, the ETF rejected the low (also the near-term resistance levels) and closed near the highs of the day. This is a sign of accumulation. Stock's of gold miners may continue to consolidate, but I believe the majority of the correction is behind us.


Mid-day Traders Edge 8/3/12- Got gold stocks

The report out of Bloomberg that Merkel's government will not stand in the way of any plans by the ECB and Draghi to directly buy government bonds appears to be lending marginal support to to the U.S. stock markets. That said, this advance (outside of the 2% gain) does not appear particularly strong. The volume is coming in on the light end (estimated to finish in the range of 110 to 140 million shares on the SPY) while the intraday technicals appear weak.


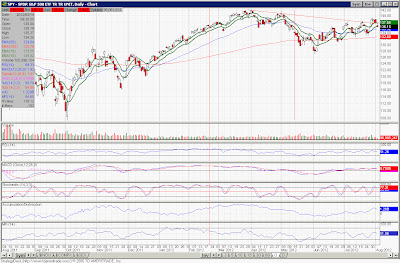
You will notice that the stochastic, A/D line, and MACD show little conviction to the upside move, and point out that the MACD is diverging from the price trend. That said, if the SPY were to close above the $139 price level it would suggest that move to next swing point, a mere two points higher.

I also think we are seeing doubt that any bond buying plan will work. Just look at the currency markets. The Powershares US Dollar Bull Index (ticker UUP) is down more than 1% in mid-day trading, but on low volume.


The mirror of this is the Currencyshares Euro Trust ETF (ticker FXE), which is up more than 1.5%. The FXE is moving up into the last swing point on weaker volume (an estimate of 1.2 to 1.5 million shares versus 2.1 million shares seen on July 27)

This report also begs the question of how the ECB will fund the purchase of sovereign bonds. The rescue funds are nearly tapped out, and there has been a reluctance from politicians to increase the size of the bailout programs. Does this mean that the ECB will hit the return key on the computer and begin printing Euros? This is still to be seen.

Either way, I thought it would conducive to update my gold stock timing indicator. This indicator compares the price of the Phily Gold/Silver Sector Index (ticker XAU) to the the standard deviation of the price of gold relative to money supply. Historically, buying opportunities on the XAU (and precious metal stocks in general) present themselves when the standard deviation falls below -1.  The below tables show the performance averages of the XUA over a one week period, three months, six months, one year, and two years since 1981.


On average, the performance in subsequent periods following a standard deviation of the price of gold relative to money supply of -1 and -2  far surpasses the respective average buy-and-hold performance. The performance figures appear robust. Just look at the minimum performance seen across all periods. Buying precious metal stocks when the standard deviation falls below -1 reduces your downside potential, at least in a historical context. In addition, the Sharpe ratios (average return divided by standard deviation of the returns) is much improved across all time periods. Here is the data represented graphically.

 The current standard deviation is -1.12.

Futures up strongly ahead of the jobs report

Outside of the fact that other traders look at and react to the data, I for one do not know why so much emphasis is placed on the monthly jobs report. The numbers are continually tweaked, have a significant standard error in any one monthly estimate, and are largely marked-to-model (i.e. fantasy). In fact, the BLS reports that more than 1.2 million jobs out of 4 million (not seasonally adjusted) were created in newly started businesses in the last year.


This assumption seems far-fetched given the state of the slow-growth economy and lack of available credit.

In any event, the Street is looking for a net creation of about 100 thousand jobs. Your guess is as good as mine as to the market's reaction. Ahead of the announcement, the futures are indicating a strong stock market opening.


The Treasury to sell floating rate notes? Floating Rates?

I guess the details of this plan remain in the works, but you have to wonder about the timing of such an action. This MarketWatch article explains that more that $660 billion in treasury paper is maturing in the next four years. The potential sale of floating rate treasury notes is obviously a plan to spark demand, enticing those bond investors that want the safety (?) of the treasury note but are worried about rising rates in the future. However, with treasuries rates across the curve at or near-all time lows, you have to be concerned about future funding costs.

Probably the most pertinent quote from the article.....
    John Lonski, chief economist at Moody’s Capital, said floating-rate notes would be attractive to
    investors who are worried that bond yields will spike in coming years as the Fed tries to exit its
    ultra-low-interest-rate policy.

   The decision to sell floating-rate notes is a “tacit admission by the U.S. Treasury that the current
   less-than 2% 10-year Treasury yield stands a high probability of not becoming a lasting feature of
   the U.S. credit market,” Lonski said.


Thursday, August 2, 2012

Mid-Day Traders Edge 8/2/12- Risk Off is Back

With nearly half the trading complete, the market is pulling back on heavy volume. This follows the ECB's announcement that they will work with the Euro nations to support their bond markets. That said, the bottom line is that the ECB failed to announce any "substantial" support (i.e. no quantitative easing).

In my opinion, the chances that the ECB would enact a large QE program was the last leg of the stool holding up the market- as lackluster second quarter earnings, uncertainty towards the world economic outlook, and no action out of Fed leaves nothing but air under the latest market advance.


As I write, volume on the SPY is on track to post somewhere in the range of 230 million to 250 million shares. The last time you saw that kind of volume was on May 17 and 18 of this year, noting that this volume level also corresponds with my short-term price outlook of around $129.

You can also see the confidence- or lack there of- in intra-day trading.

You will see that the market retraced the opening down draft, fully closing the gap. Once completed, heavy volume came in towards the downside, pushing the SPY down more than 1 percentage point versus yesterday's close. I would suspect this is institutional money coming out the market. Without some clarity to Europe's woes, action by the Fed (which by the way I think will not occur until money supply and/or the market contracts in conjunction with a decline in employment levels), or an improved earnings outlook, it is likely that institutions will continue to lighten their equity holdings.

Lastly and just as a note, the yields on the ten and five year treasuries are falling. In conjunction the dollar (as shown in the performance of the UUP), is rising. The risk-off trade is back.

Update- No action from the ECB, futures slide, Are your shorts on?

An excerpt from the Bloomberg article, more at the link


U.S. Stock Futures Fall After Comments by ECB’s Draghi


U.S. stock futures declined, indicating the Standard & Poor’s 500 Index will drop a fourth day, as the European Central Bank Mario Draghi failed to reassure investors on immediate efforts to bolster the economy.
Knight Capital Group Inc. (KCG) plunged 56 percent after saying losses from yesterday’s trading breakdown are $440 million, more than some analysts had estimated, and it is exploring strategic and financial alternatives. Abercrombie & Fitch Co. (ANF) tumbled 15 percent after the teen retailer cut its profit forecast. First Solar Inc. (FSLR), the biggest maker of thin-film panels, soared 17 percent after an 81 percent jump in earnings.
S&P 500 futures expiring in September fell 0.7 percent to 1,360.90 at 9:14 a.m. New York time. Dow Jones Industrial Average futures slid 77 points, or 0.6 percent, to 12,846. The number of shares changing hands in Stoxx Europe 600 Index’s companies was 6.8 percent lower than the 30-day average at this time of day, according to data compiled by Bloomberg.
“Traders and investors who expected immediate action are, and should be, disappointed,” Carl Weinberg, founder and chief economist of High Frequency Economics, wrote in a note today. “Clearly, the action plan is still lacking details.”
European Central Bank President Mario Draghi signaled the bank will join forces with governments to buy sovereign bonds in sufficient quantities to remove all doubts about the future of the euro. Any ECB bond purchases will be conducted in a way to soothe investors’ concerns about seniority, Draghi told said at a press conference today, after keeping the benchmark interest rate on hold at 0.75 percent. Details of the bond purchase plan will be fleshed out in coming weeks, he said.

As I stated in other posts, watch for SPY to close that gap around $129. Are your shorts on?

Wednesday, August 1, 2012

Annotated FOMC Statement

Confirming my opinion, the FOMC made no change to monetary policy. The FOMC did graciously provide  what investors should watch, going forward, to gauge any future policy actions. Here is the annotated press release.

Press Release

Release Date: August 1, 2012

For immediate release

Information received since the Federal Open Market Committee met in June suggests that economic activity decelerated somewhat over the first half of this year. Growth in employment has been slow in recent months, and the unemployment rate remains elevated. (High unemployment is on our minds but the rate of change remains positive, painfully slow but still positive. We cannot move yet, sorry.) Business fixed investment has continued to advance. Household spending has been rising at a somewhat slower pace than earlier in the year. Despite some further signs of improvement, the housing sector remains depressed.(The economy continues to improve but still at a painfully slow rate) Inflation has declined since earlier this year, mainly reflecting lower prices of crude oil and gasoline, and longer-term inflation expectations have remained stable.(Our measure of inflation is not a problem, so you can ignore it)

Consistent with its statutory mandate, the Committee seeks to foster maximum employment and price stability. The Committee expects economic growth to remain moderate over coming quarters and then to pick up very gradually. Consequently, the Committee anticipates that the unemployment rate will decline only slowly toward levels that it judges to be consistent with its dual mandate. Furthermore, strains in global financial markets continue to pose significant downside risks to the economic outlook. The Committee anticipates that inflation over the medium term will run at or below the rate that it judges most consistent with its dual mandate.

To support a stronger economic recovery and to help ensure that inflation, over time, is at the rate most consistent with its dual mandate, the Committee expects to maintain a highly accommodative stance for monetary policy. In particular, the Committee decided today to keep the target range for the federal funds rate at 0 to 1/4 percent and currently anticipates that economic conditions--including low rates of resource utilization and a subdued outlook for inflation over the medium run--are likely to warrant exceptionally low levels for the federal funds rate at least through late 2014.(No change in policy yet)

The Committee also decided to continue through the end of the year its program to extend the average maturity of its holdings of securities as announced in June, and it is maintaining its existing policy of reinvesting principal payments from its holdings of agency debt and agency mortgage-backed securities in agency mortgage-backed securities. The Committee will closely monitor incoming information on economic and financial developments and will provide additional accommodation as needed to promote a stronger economic recovery and sustained improvement in labor market conditions in a context of price stability.(We will maintain the current operation twist policy and angency-debt reinvestment program, don't expect any changes to this until one or more of the measures we talked about above change considerably)

Voting for the FOMC monetary policy action were: Ben S. Bernanke, Chairman; William C. Dudley, Vice Chairman; Elizabeth A. Duke; Dennis P. Lockhart; Sandra Pianalto; Jerome H. Powell; Sarah Bloom Raskin; Jeremy C. Stein; Daniel K. Tarullo; John C. Williams; and Janet L. Yellen. Voting against the action was Jeffrey M. Lacker, who preferred to omit the description of the time period over which economic conditions are likely to warrant an exceptionally low level of the federal funds rate.

 Interestingly, the precious metal stocks are acting positively following the FOMC statement. See the Phily Gold/Silver Index and the Marketvectors Gold Miner ETF (ticker GDX) intra-day chart seen below.


In contrast, both gold and silver sold off on the Fed statement. The intra-day charts for the GLD and the SLV are found below.


Late Morning Links 8-1-12

The ESM granted a banking license to buy Italian and Spanish Bonds?
       Rumor

From natural resources to currency wars... the race to bottom with continue

Garbage freight is in decline, a bad economic omen?

A new name for higher inflation, nominal GDP targeting.

Is Ms. Mayer in over her head at Yahoo, I hope not, as the portfolios I manage have a small position in YHOO, albeit as a play on its investments and the position represents gains of past holdings.


The Euro as special drawing rights

This should be a positive for commodity prices, especially coal. The slowdown in investment has typically been a positive for commodity prices and commodity producers, as lower investment has marked the bottom of many cycles.

Small talk tips for those who hate small talk 

Wow, can't make the hurdle just lower the hurdle. This is a bad omen for the education system in the United States.

It is ISM day-

Another negative print on the ISM.....

MANUFACTURING AT A GLANCE
JULY 2012


Index
Series
Index
Jul
Series
Index
Jun
Percentage
Point
Change


Direction
Rate
of
Change

Trend*
(Months)
PMI 49.8 49.7 +0.1 Contracting Slower 2
New Orders 48.0 47.8 +0.2 Contracting Slower 2
Production 51.3 51.0 +0.3 Growing Faster 38
Employment 52.0 56.6 -4.6 Growing Slower 34
Supplier Deliveries 48.7 48.9 -0.2 Faster Faster 6
Inventories 49.0 44.0 +5.0 Contracting Slower 4
Customers' Inventories 49.5 48.5 +1.0 Too Low Slower 8
Prices 39.5 37.0 +2.5 Decreasing Slower 3
Backlog of Orders 43.0 44.5 -1.5 Contracting Faster 4
Exports 46.5 47.5 -1.0 Contracting Faster 2
Imports 50.5 53.5 -3.0 Growing Slower 8
             
OVERALL ECONOMY Growing Faster 38
Manufacturing Sector Contracting Slower 2

... and it is likely to stay that way. Although the PMI was essentially flat, as slightly higher new orders and production measures offset declines in employment, other and more forward looking measures look weak. The inventories measures suggests a contraction in inventories (which is a positive). However, the decline is slowing, and inventories may increase in future periods without slower production rates and/or an increase in new orders. Ominously, the order backlogs declined again to 43, suggesting a slow down in future production absent of a bump in new orders. As the latter is concerned, the customer inventories index ticked up to 49.5. This measure typically runs inverse to new orders and suggests weak new order prints in future periods. In addition, the exports figure declined once again, obviously showing the weakness in the world economy.

Traders Edge 8/1/12

Today is Fed announcement day. The market has opened up, but I would expect mainly flat performance until the Fed announces the outcome of their July/August meeting. I maintain the belief that the market run is failing and that we will retest the June swing point, closing the gap at or below $130 price level on the SPY.


I continue to believe that Fed WILL pursue further quantitative easing programs in the future. However, it is unlikely that the future is today. Monetary supply continues to show growth while market performance remains in the positive territory on a year-over-year basis, suggesting no to little change in monetary stimulus actions. Employment, which has been a key flash point to investors, as it is a part of the Fed's dual mandate, continues to gain. Albeit painfully slow. We find it unlikely that the Fed will move until slowing growth becomes outright declines in monetary supply, the market and employment. Add to this is the uncertainty created with rising food and energy prices, which are likely to add to inflation later in the year.the prospect of higher inflation may force the Fed into a wait-and-see attitude.

One last note on gauging the likelihood of an expansion of monetary stimulus, the precious metals and precious metal stocks- investments sensitive to changes in monetary supply and interest rates- are getting hammered in A.M. trading. The Phily Gold/Silver Index (ticker XAU) is down more than 2% while the market Vectors Gold Miner ETF (ticker GDX) is down about 3%. See the charts below.


The GDX's decline is on particularly heavy volume. Either the operators are acting to get in ahead of a monetary action by the Fed or investors are getting out ahead of no action. I think you know what I think.

Dropping the "we" veneer

It feels a little strange, but I am dropping the "we" veneer. For most of my career, I have written in the plural "we" versus the singular "I", having worked on both the buy side and sell side in the investment management industry and tasked with presenting the company's ideas before my own. Hence, the we veneer. It felt easy and free to write in the plural, as an extension of the way I have typically operated.

However, one cannot grow without change. I wanted to liberate myself from that shackle and present my ideas, opinions, and recommendations without any pretense. Hopefully, positive change will follow. 

With that said, I do have some plans (grandiose and small) for this blog and you will see many things tried. I hope you find my opinions compelling and thought provoking.

Have a Great Trading Day,

M.Christy.

Tuesday, July 31, 2012

Drought leading to higher energy prices as well higher food prices

Interesting, in a world where fracking is leading incremental energy growth, a lack of water is resulting in to reduced production or oil and gas. Not only will this drought lead to higher food prices world wide, it may also boost our energy bills.

Traders Edge 7/31/12- Revenge of Risk Off.

The "Risk On" trade that began with Draghi stating that the ECB will do whatever it takes to save the Euro is likely to fail. The SPY just could not get things going following Friday's rally and it closed essentially flat in yesterday's trading. The ETF is trading up into the May 4 swing point on volume of only 106.8 million versus 193.3 million shares on the May downdraft. This is not enough and suggests that the rally will fail.


The rally that began off the June 1 low has not been confirmed by the stochastics, RSI, or MACD. All these measures suggests that momentum and upside strength is weakening. Couple this technical outlook with the fundamental backdrop of a weak economic environment, slowing earnings growth, revenue results that are missing forecasts, and a market rallying on the hope of a Fed easing event (which we do not see) leads us to conclude that the market is near a short-term top and that the high volume low on May 18 (a $129 price point) may be tested.


We also see confirmation of this view in the currency markets. The pullback in the UUP has occurred on lighter volume while the MACD remains positive, suggesting that the recent pullback is just a pause. As for the Euro, the CurrencyShares Euro Trust ETF (ticker FXE) rally attempt appears to have failed. The MACD remains in a negative range and the July 27th rally attempt broke down as it retested the May 30 resistance level, which is plainly seen in the Intraday chart below.


To us, this suggests the "risk on" trade will end shortly. Our shorts are still on, are yours?

Monday, July 30, 2012

Maybe time to take another run at ACI

Just a quick note on the ACI (disclosure- we own shares of ACI in our portfolios.), we thought we would highlight the shares as not only offering a great long-term entry point, but possibly a short-term opportunity as well. Shares gained 29% in Friday's trading on both better-than-expected earnings and short covering. Today, the shares caught on upgrade from Sterne Agee and are trading up in the pre-open market.


ACI's share price appears to be stabilizing and have closed at the trend line established since February. A close above this level on volume could suggest the shares move into the swing point around $10 per share. A nearly 40% gain from current trading levels. 

Traders Edge 7/30/12-Let the good times coal

It appears the good-time feelings in coal investors is set to roll again, following through on Friday's extraordinary gains. On Friday, shares of Arch coal (ticker ACI) led the charge, gaining more than 29%, a result of better-than-expected earnings and short-covering. Other companies in the space saw their shares rise in response to the euphoria, as the stock of Alpha Natural Resources (ticker ANR) gained 20%, Peabody Energy (ticker BTU) up 6%, shares of Walter Energy improved 5.6%, and the Market Vectors Coal ETF (ticker KOL) increased 4%. Today, ACI caught an upgrade from Sterne Agee on cost cutting, better thermal coal competitiveness, and valuation. The rest of coal industry looks to be reacting positively to the upgrade in the pre-open trading.

Look ahead, we continue to think that coal stocks offer an attractive long-term buying opportunity. We see the improving thermal coal economics as providing a catalyst to shares short-term and helping shares stabilize in or around current levels. Coal companies with a higher percentage of thermal coal will likely outperform their metallurgical coal heavy brethren- as the economics in steel production shows signs of waning for now. Just look at the chart of the relative price of Cloud Peak Energy (ticker CLD), the producer of thermal coal from the Powder River basis versus WLT, the coal company with the largest percentage of metallurgical coal in its product portfolio.

CLD has far out-paced shares in WLT, on, in our opinion, the improving outlook for thermal coal versus metallurgical coal.

Another important factor for coal stocks is cost cutting. We believe that those companies that are better able to manage costs will be better performers. Coal mining is a capital intensive business and the industry operates under high fixed costs. For the most part, declining production and sales volumes will lead to higher production costs per ton and lower per ton margins. We are impressed and found surprising that companies such as ACI and Consol Energy (ticker CNX) were able to reduce their per ton operating costs, be it company wide or on a regional basis. With the high level of fixed costs, these cost cutting initiatives are setting up substantial earnings gains once pricing rebounds.

As for the charts, we are seeing a bifurcation for the coal industry share prices. The charts for CLD, CNX, and ACI appear to forming bases while the charts for BTU, ANR, WLT show little signs that the selling is complete.


The above two charts are examples of this dynamic (disclosure we own both ACI and ANR). Shares of ACI closed at the trend line established since February, and if today's optimism holds we could see $10 in a heartbeat. The chart for ANR suggests that more work needs to be done for before the all clear signal is given.

As for the market, futures are mixed this morning despite gains overseas. Although we think the gains experienced last week are fleeting, we also think that market will try another run towards recent highs before failing. We detailed our thoughts more on Sunday post.


Sunday, July 29, 2012

Traders Edge 7/29/12 Sunday Edition.

Friday was a very interesting day. The SPY traded up significantly and the price/volume characteristics suggest that the ETF (and the market itself) will trade up into or close to recent highs.

The spy has broken the trend line that had been established at the beginning of April on volume that is higher than relevant swing points This suggests that the SPY is going to test the next swing point, or around $140 price level. That said, it is our conjecture that the optimism reflected in share prices is built on fumes, namely the anticipation of some monetary action by the Federal Reserve. This is occurring amongst a lackluster economic environment, as revenue and earnings growth slow considerably. Unless the next monetary stimulus action actually propels the economy forward, then this optimism is likely misplaced. In contract, QE1, QE2, Operation Twist, and the other monetary actions by the Fed and other central banks have failed to accelerate economic growth. We think that a QE3 will be no different.


We also note the strength in the SPY is not being reflected in the small cap stocks. Above we present the IWN, the IShares Russell 2000 small cap stock index ETF. The upward swing in Friday was not confirmed by volume, and the downward trend that began in April remains.