Friday, December 6, 2013

Colored Bitcoins and a Glimpse the Future

The below article comes from New Scientist. And if you think that Bitcoin is just about money, think again. The technology around Bitcoin may be far more, for a lack of a better description at the moment, robust.

via New Scientist

Bitcoin is money – people can use it to buy anything from pizza to plastic surgery. The meteoric rise of the online currency has caused everyone from financial regulators to law enforcement to the US Senate to stand up and take notice. But a growing group of computer scientists think this is just the beginning. They are convinced that Bitcoin's real value is not in providing the world with a currency free from government intervention, but in the technology which underpins it, a secure system of verifying transactions that they believe has the potential to vastly disrupt the way we exchange goods and services around the world.

The secret to Bitcoin's rampant success is the "block chain" – a secure digital ledger that tracks coins across the internet. It records every single transaction of the currency, and those transactions are then
mathematically verified by the computers of Bitcoin users around the world. Anyone who holds bitcoins also has an exact copy of the block chain, making it virtually impossible to create a forgery. This eliminates the need for trusted third parties, like PayPal and Visa, to take part in financial transactions.

Now the block chain is being applied beyond the movement of money using a technique called "colouring" bitcoins. It has the potential to transform commerce. Take the buying and selling of real estate, for example. In a statement before the US Senate Committee on Banking, Housing and Urban Affairs on 19 November, Anthony Gallippi, CEO of Bitcoin payment firm BitPay, described how co-opting the block chain could do away with the gaggle of fees and legal manoeuvrings that usually accompany home sales.

"The biggest up­front costs for consumers trying to buy a home are the closing costs, which include fees for deeds, titles, stamps, title insurance, and other redundant tasks to record the sale in different record books," Gallippi said. "Bitcoin can replace thousands of dollars in closing costs with a single transaction that costs 5 cents. By reporting deeds and titles on the block chain, the information would be public record forever, for pennies, and eliminate the need for title insurance."

Indelible record

Colouring bitcoins is a way of digitally labelling a bitcoin or a fraction of one with information about a transaction. When the labelled coin changes hands, it gets indelibly recorded in the block chain. It's the equivalent of recording the sale of a flock of sheep by writing a message to that effect on a $1 bill, and giving that to the buyer – only with Bitcoin, that record is mathematically confirmed nearly instantly by computers all over the world.

A few researchers have already done this. Amos Meiri, a computer scientist with the social stock-trading firm eToro, based in Cyprus, says he ran a proof of concept last year. He transferred a Bitcoin, coloured to represent a sum of gold, through the block chain. Through an organisation called Colored Coins, Meiri and others plan to launch a beta version of software that executes this process in the next few weeks.

"I'm able to issue one coloured coin which resembles 1000 shares of stock, and sell it to you," Meiri, says. "When I sell it to you I give you all the rights for voting and dividends without paying a commission to stock markets or brokers. We basically put another layer above Bitcoin. Instead of holding the currency, you'll be able to hold and trade gold, Apple stock, your own car."

Others are building similar services. Mike Hearn, a computer scientist based in Zurich, Switzerland, has developed an application called PayFile which uses Bitcoin's block chain to keep track of a user's downloads, and pay for bandwidth automatically as they go. Hearn says PayFile is more a demonstration of what the Bitcoin ledger can do, rather than a fully fledged commercial service, but says it points to a future where the block chain will be used for all sorts of transactions.

 All I have to say is wow, if you cannot see the disruptive innovation aspects in that. 

Jobs Report Slays Bears........................... Hardly

The jobs report shows continued gained. However and like I showed previously (thanks to analysis by MISH) the establishment data is skewed. Although the household data also showed gains, the rate of change of the rate of change in the number of employed persons continues to be highly negative. Although the Street.com's video below lays out how the jobs report destroyed the bear case, I will show shortly how this the job numbers continue to flash a warning signal.

Dumb Luck, Wash Trading & Gold Suppression- Rogers & Keiser


Where To Buy In 2014- Jim Rogers

Here, Jim Rogers speaks to CBC TV. Not only does he discuss some long picks, but he discusses a working thesis of my.... that fracking oil production is not the panacea it is made out to be.


High Volume High- Dec. 5 trading Day Edition

An eclectic list seen in yesterday's trading. One notable name is NM, the dry goods shipper. The stock popped on what appears to be no news. Although, other shippers also increased on the day. the industry has been caught a bid in recent months (full disclosure- I have a position in Diana Shipping- ticker DSX) has the Street has began to look ahead at a turnaround in the industry. This is after years of under performance, both fundamentally and by the industry's investments. The turnaround looks to be predicated on a number of coinciding events including the slowdown in ship deliveries from orders placed years ago, an increase in ship scrap rates (both working to reduce supply) in conjunction with a higher Baltic Dry Shipping Rate, the later indicating increased demand.


Volume Off the High- Dec. 5 Trading Day Ediiton

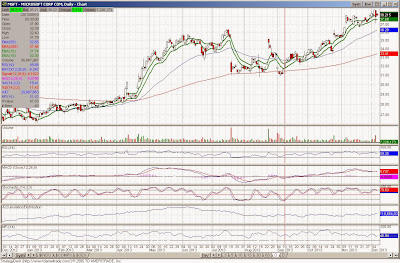
A couple notable names in a small list. First is MSFT. Although the Microsoft's price only fell $0.94, this was on expanded volume, a negative sign. This was on the news that Ford's Mulally, a candidate for Ballmer's desk, was staying with the auto producer. This is one to watch for two reason. For one, there is a higher volume gap open at the $29 price level, some $10 points lower than current prices. Secondly, any price decline in MSFT would put pressure on the Dow and S&P.

Second there is ULTA, which reported earnings light of estimates. Although the miss was only by about $0.02 per share, someone appears to have got wind of the late announcement before hand, as shares fell hard prior to earnings announcement (and by the way, I am pegging the inclusion of ULTA on the Dec. 5 price action and not the decimation the stock is taking today). The gap below $88 will likely be closed if not a full retracement to the high volume low at $74. The stock currently trades at about $94.


All Wound Up- S&P 500 Price/Volume Heat Map for Dec. 5 Trading Day

Yes, we saw another distributive day on the S&P 500, as the market fell about 40 basis points with supply side dynamics coming in heavier in some select sectors. That said, this overall volume levels contracted versus the the prior day. Additionally.........


..... the more cyclical sectors outperformed both the non-cyclicals (where the supply side dynamics were focused) and the market as a whole. More so, the cyclical groups price/volume dynamics were more benign, relatively speaking. With this setup, I am not surprised that equity prices popped after the employment report, especially considering we had seen declines for four days in a row. I would suggest watching the volume levels as the S&P 500 approaches the high. If volume levels pull back and prices cannot get through the highs, it is likely that the strong opening move in equities was nothing more than traders trying to exit positions by pulling fresh blood.


Problems With The CPI- The Mises View

with Peter Klein


Economic Lesson of the Day

Economics is about the allocation of scarce resources and prices are the mechanism that transmit information to economic participants. Distorting the pricing mechanism (be it through QE, setting interest rates, mandating minimum wages, welfare, industry subsidies, the list goes on) retards the information flow and creates imbalances, imbalances that always correct and in some instances painfully so.
(br />

The Top 5 U.S. (Libertarian) Presidents

I am not the smartest man in the world but I see a pattern here.

Thursday, December 5, 2013

IDEA VELOCITY. What I learned from SAC.

Can't say I know or have any history with this person/blog, but the thoughts in the post are compelling.

SAC, the infamous hedge fund led by mercurial, secretive, super art collector Stevie Cohen is legendary. They have recently been accused of insider trading and it sure looks like they are guilty.  But there are a lot of very smart people that worked there that had nothing to do with this scandal. PMs and analysts in Hedgistan dream of toiling there and making obscene riches.  As an unabashed trading addict and player of The Game, I was like a moth to the flame.  I had to check this place out.  I did.  Although by dumb luck and a well-calibrated BS detector, I was able to avoid joining them, I did meet with them over a dozen times.  I learned some principles that have changed my way of trading forever.  For the good.  Out of a spirit of equanimity and gratitude, I will share them with you.


1. RULE ONE: IDEA VELOCITY.  This is so important and it will seem so obvious after I tell you that you will wonder why no one talks about it.  Let’s do some math.  Let’s say you’re a long-short PM and you typically have 15 longs and 8 shorts at any given time.  Call it 25 positions.  If your average holding period is 6 months because your portfolio turns over twice a year, which is fairly typical for an actively managed stock fund, that means you need 50 positions per year.  That is one high conviction idea per week!  That doesn’t sound like all that much, but tell me, do you really have a discipline in place to come up with at least one, highly researched, well-thought out, high conviction idea per week?  I’m not talking about being pitched a quick stock pick by the sell-side either.  .  In tech, things change fast, and sitting on winners that have stalled out too long is a mistake.  It’s also called complacency.  The only way to know these numbers, such as your average holding period, number of positions, is to analyze your trading records ruthlessly and honestly. This is the concept of IDEA VELOCITY.

2. POSITION SIZING.  When you find an idea, a high conviction stock idea, how do you build your position?  Do you scale in?  Do you buy half and another half later after you see how the stock trades?  This is what most investors do.  TOTALLY WRONG.  That’s right.  If you have a high conviction, well-researched idea, what is the point in putting on only a half position?  If your original position drops by 15%, what do you do, buy more?  Does that make any sense?  Or if it goes up after you buy it, yes, it makes sense to buy more, but didn’t you just lose the gains you would have had if you had the cojones to buy the whole position at once?  Furthermore, what are you doing putting on a “half position” if you don’t have the conviction to put on a full position.  So when you put on a position, do it all, at once, one day.  POSITION SIZING- the key to good performance.

3. CASH IN THE PORTFOLIO.  How much cash should you carry in your portfolio?  Most PMs will play around with the amount of cash in their fund.  Some even brag about how their performance for is all of the S&P upside while being only 65% invested, because they are holding 35% in cash.  What kind of stupid logic is this? If I’m paying you 2 and 20 to invest my money, then invest it all!  This is the key concept- INVEST IT ALL!  If you are so good that you can get all of the S&P returns with 35% cash, then just give me the cash back so I don’t have to pay 2% on the cash.  Let me make my own asset allocation decisions. So an equity long-short fund should be 100% long and some portion short.  In SAC case, they would prefer PMs be no more than 15% net long, so that meant they would be 100% long and 85% short for example.  I’m not advocating that.  But I’m saying equity funds should not carry more than a minimal amount of cash.  If you don’t have ideas for the money you’re managing, you need to re-read rule number one, IDEA VELOCITY.

4. SHORTING INDICES.  Many fund managers think they are great stock pickers.  Actually, we all do, by definition, because we are charging people for our great skills- otherwise they could cheaply invest in an unmanaged index.  But these same managers decide they will pick the longs in the fund and then use an ETF to short against the longs, as a “hedge.”  WTF kind of backward thinking is this?  So you can pick what stocks will go up, and not the stocks that can go down?  Does this make any sense?  Then the clever among this group will argue with you that because the market goes up over time, it’s important to spend time on longs and “hedges always lose money.”  NONSENSE.  Even in a bull market there are stocks that are going down. (Do you need examples?  IBM, “Big Blue,” the bluest of the blue chip techs,  is down 8.5% as I write this, versus the NASDAQ up 33% for the year.) I’ll tell you what- if you want to play with indices, and you tell me the market goes up most of the time, I will suggest that you LONG the index and spend all your time finding individual name shorts instead.  Did your brain just blow a fuse?  Let me suggest the best approach and that is pick longs and shorts and never short an index.  If you don’t have enough shorts, because “Shorting is hard” and all that, then go re-read RULE NUMBER ONE.

5. COLD STREAKS.  SAC is ruthless, because they employ a lot of leverage.  When one of their PM has a big drawdown, they tell them to slow down.  This is the one case in which a PM will carry more cash.  Or quite simply get some of their assets pulled from them.  So let’s say you’re cold, your strategy and discipline is not currently working, and you need to cut back your positions.  What do you do?  TRADE SMALLER.  So that means keep making new trades.  Don’t freeze up.  Did Jordan quit shooting when he got cold?  So if you are going to cut your portfolio in half, say, to quell the bleeding, how do you do it?  Most people will say, “well, I’ll cut my lowest conviction positions and keep the ones I really like.”  Wait a minute- more stupid logic.  What business do you have holding ANY low conviction positions?  The right answer is you cut your entire portfolio in half, equally, across the board.  If you have low conviction positions, you haven’t been following RULE ONE- IDEA VELOCITY.

So perhaps it’s obvious to you now how important the idea of IDEA VELOCITY is to a trader/investor.  It’s the underpinning of everything in The Game.  You have to work VERY HARD to come up with high conviction ideas every single week.  The hours you have to put into this Game and the mental horsepower and the emotional toll are all much, much greater than most people realize.  You can see why some of them wanted to cheat, to cut corners.  This is a tough game.  You know what?  SAC didn’t need to cheat.  If they all would have stuck with these principles, they would be thriving today.  You can adopt these principles into your trading regimen and improve your performance.

Watch Household Jobs Data

As I have detailed for you in the past (for instance here), the acceleration and deceleration of employment levels can be a significant and useful indicator to gauge current and future economic growth. More so, I employed the household data over the establishment data, primarily based on research (for instance research done by ECRI) on the versatility of the household data. Maybe you should begin looking at the household over the establishment data also. To that end, Michael Shedlock looks at the difference between the two data sets and the potentially significant problems in the establishment data.

via Michael Shedlock

Every month (on average), for about a year, there has been a startling discrepancy between employment as measured by the household survey and jobs as reported by the establishment survey.

I believe the discrepancy is yet another Obamacare artifact.

Jobs vs. Employment Discussion

Before diving into the details, it is important to understand limits on data, and how the BLS measures jobs in the establishment survey vs. employment in the household survey.

Establishment Survey: If you work one hour that counts as a job. There is no difference between one hour and 50 hours.
Establishment Survey: If you work multiple jobs you are counted twice. The BLS does not weed out duplicate social security numbers.

Household Survey: If you work one hour or 80 you are employed.
Household Survey: If you work a total of 35 hours you are considered a full time employee. If you work 25 hours at one job and 10 hours at another, you are a fulltime employee.

Recall that the definition of fulltime under Obamacare is 30 hours, but fulltime to the BLS is 35 hours.

Next, consider what happens under Obamacare if someone working 34 hours is cut back to 25 hours, then picks up another parttime job.

Obamacare Effect

Prior to Obamacare
34 hours worked = 1 parttime job household survey
34 hours worked = 1 job establishment survey

Enter obamacare
Person cut back to 25 hours and takes a second job for 10 hours
Here is the new math

25 + 10 = 1 fulltime job on the household survey.
25 + 10 = 2 jobs on the establishment survey.

In my example, the household survey totals up all the hours and says, voilla! (35 hours = full time). So a few extra hours that people pick up working 2 part time jobs now throws someone into full time status – thus no surge in part-time employment, but there is a surge in jobs.


The whole article can be read at the link above, but this does call into the question the integrity of the establishment data.

GDP Sends Warning Signals

Although GDP growth was revised upward, coming in at a year-over-year growth rate of about 1.8% and toning down the recession risks, underlying risks do remain. This thought is now starting to permeate the market's psyche.


With that said, we will have to see what the employment data tells us tomorrow, as it may continue to indicate a slowing in economic growth. And thinking of employment watch the household number.....

How Could the Fed Not Taper..... Here's Why

The Street.com was out early today stating. " how can Fed not taper".


Well besides from data that indicates that economic growth remains weak (as money growth, employment, business investment, and lending show slowing growth, albeit as the recent manufacturing ISM and today's revised GDP suggest reduced recession risks), any slowdown in money printing will negatively effect the markets. If you do not believe me, let history be your guide via the NASDAQ crash of 2000.


A Golden Dawn for the Precious Metals and Miners?.... Probably, But When?

You probably have already heard much of the bull case laid out here for gold and the miners.... although talk of China's potential deal with Barrick is a new one. Still, I would urge being somewhat cautious despite my timing models holding in a buy zone. I may wait for a sign of strength (like what we saw in yesterday's trading with gold and miners rejecting lows on accelerated volume and exhibiting wider price spreads) or a turn in the risk model talked about here.

Best Shorting Opportunity In Years?

My timing has been off a few times now, but I agree that the opportunity on the short side is compelling. The commentator in the below video discusses shorting the 3D printers, which may be worth the effort but the momentum in the names, at least to me, suggests using tight stops on any short in this space.


Volume Off the High- Dec. 4 Trading Day Edition

In yesterday's trading, a few consumer and healthcare related names came off the highs with volume support. Bob Evans is particularly noteworthy, as the company reported earnings that missed expectations by $0.20 not only on increased costs but lower expected sales. Not only are the results noteworthy because of the large miss, but it also appears that some investors were anticipating miss, with price/volume characteristics indicating investors getting out of the stock ahead of earnings. More so, some short-side profits may be made here, as price action puts the gap opened at $48 in play. The gap is nearly $3 lower than current prices. Not a large scalping, but maybe for a quick buck.


High Volume High- Dec. 4 Trading Day Edition

Expanding one name on the volume movers list, CF Industries popped, along with with many other names in the fertilizer business by the way, on talk that the company was exploring the potential change its corporate structure to a master limited partnership (MLP) from a C corporation. You could look up the definition of an MLP that would go into far more than what I am about to briefly describe but an MLP corporate structure allows and requires most of a companies earnings to passed through to equity owners in the form of dividends. In turn, the corporate entity gains a tax advantage. I would not be surprised if more resource or asset rich companies explore this option.


A Lot Of Sound and Fury Signifying Nothing- S&P 500 Price/Volume Heat Map For Dec. 4

A lot of churning is yesterday's trading day, with the S&P trading to the positive and negative side throughout the day but closing ultimately closing lower on yet another day of accelerated volume. Although the accelerated volume could indicate some institutions getting out of equities, the absolute levels remain within the range of average trading volume levels. Additionally, with the market ending essentially flat on the day probably indicates that the established trend remains in place.


The price/volume heat map also suggests general churning in the market with demand largely matched with supply. That said, healthcare names looked to be under some distribution.


Time for Goldbugs to Admit Defeat?

 Jeff Clark, Senior Precious Metals Analyst, Casey Research

After a 12-year run, it looks like gold's wave has truly crested, and many bears are arguing that it's all downhill from here. A quick glance at a long-term gold price chart can certainly seem to confirm this impression.

Gold's price has fallen by more than a third since its 2011 high. The downturn exceeds the 2008 waterfall selloff. Many technical analysts are saying that the "damage" on the charts is too great for gold to recover. The rout is so bad, even hardened goldbugs have grown quiet lately.

Is it time for gold investors to admit defeat?

Well, if it were true that "damage" on a chart such as we've seen signals the end of a bull market, perhaps it might be. But is it so? Or is this just a correction?

One of the greatest bull markets in modern times was the Nasdaq in the 1990s. The Nasdaq composite rose a whopping 1,150% over the span of a decade. But did you know it had a major correction in the middle of that run? The same is true of oil's big surge in the mid-2000s. Consider this chart of the big corrections oil and the Nasdaq experienced:

After seeing prices crash in both the Nasdaq and oil, most investors assumed those bull markets were over—but they weren't. Here's the subsequent rise in each after prices bottomed:

The Nasdaq and oil did recover from their large corrections—despite all the technical "damage" many pointed to as proof that those bull markets were over. Investors who sold their positions during the downdrafts missed out on some fantastic profits.

Given that all the reasons gold rose from 2001 to 2011 are still in force, I am convinced gold's current correction is the setup for a second big surge—and, ultimately, a true gold mania of historic proportions.

Just because gold doesn't seem to be reacting to Fed money-printing at the moment doesn't mean it won't. Sooner or later, reality trumps fantasy. Reason says that you can't quintuple your balance sheet in five years and expect no repercussions. The Fed keeps hinting it will taper its money printing, but it still has not. We've had QE1, QE2, Operation Twist, and now QE3… none of them has worked, and the new Fed chair wants to print even more money.

It's pure fantasy to believe there will be no consequences to these actions—and the reality is that whatever else happens, gold will react positively.

Should gold investors admit defeat? I say it's reckless central bankers who should declare defeat.

Wednesday, December 4, 2013

Bitcoin Could Destroy the Dollar- Ron Paul

Excerpted from CNN

There will be alternatives to the dollar, and this might be one of them," said former U.S. congressman Ron Paul. If people start using bitcoins en masse, "it'll go down in history as the destroyer of the dollar," Paul added.

But don't expect governments and banks to let Bitcoin take over so easily. Financial institutions will lose business if people stop using their payment systems, and central banks like the U.S. Federal Reserve would lose their ability to help slow and speed up economic activity. Paul expects banks to lobby and authorities to crack down.

"Governments absolutely demand a monopoly on money and credit. They're not going to give it up easily," Paul warned. "They will come down hard."

In a few sentences, Dr. Paul encapsulated the many nuances of the Bitcoin movement, and most pointedly alludes to a very likely event of the digital currencies rise, a government crackdown. However considering that the technological infrastructure is an open source code freely available, the cat is out of bag and putting it back may be increasingly hard if not impossible. Although it is my belief that Bitcoin is more of a speculative bubble versus a real competitive currency at this point........ the chart just screams bubble in my opinion......


and that its credibility as a currency will likely be tarnished once the speculative fever escapes, I also think you should consider that the technological architecture puts in play a real possibility of not one alternative competitive currency, but many competitive currencies. And isn't competition at the heart of capitalism?


Volume Off the High- Dec. 3 Trading Day Edition

A few former high flyers coming off the high viciously in yesterday's trading. For instance, KKD fell hard after providing guidance that was lighter than investors were apparently looking for. Looking at KKD, I would be weary of the gap between $14 and $15 per share, more than $4 downside from yesterday's close.


High Volume High- Dec. 3 Trading Day Edition

Not many names here with the market in retreat.


Start of Something More?- S&P 500 Price/Volume Heat Map for Dec. 3

Strangely and mixed dynamics underlying the market moves in yesterday's trading. Although the market sold off by about 30 basis points, the selling pressure (either on a price basis or a supply/demand basis) was not ubiquitous. Additionally, total volume accelerated a bit as equity prices pulled back. The benckmark here on the previous comment was versus Monday's trading volumes. We will have to see if this indicates something more than mere profit taking. However, the expansion may be indicating a drawdown to about the 50-day moving average on the S&P 500.


Looking at the supply/demand balance in yesterday's trading, I would characterize the dynamics as strange. Strange in that this was the first move in a long while where sector supply and demand balances were uneven. I am unsure if there is a message in this or if it is just noise, but you should note the strong demand in staples versus the increased supply in more cyclical sectors.


Tuesday, December 3, 2013

Bitcoin- Schiff Versus Voorhees

The fact that the talk of Bitcoin gravitates towards how much one can make on the price of Bitcoin means that the neo-currency is not ready for prime time. 

Gold To Surprise in 2014?- Kitco's Hug

I agree with Peter's thesis that gold will likely bounce once the Fed leaves QE unchanged in the next meeting. The question is then, then what? QE in the next meeting, which I think is unlikely. That aside, the market will most likely be in the taper camp. Although, I do like that the San Francisco conference tone was bearish.


And Yet Another Perspective on the Bitcoin Bubble

Yes, I am calling the Bitcoin price a bubble..... and why not. I would be curious to see what happens to the infrastructure after Bitcoin prices come back to Earth.

An excerpt from by Gonzola Lira. 

There’s just one teeny-weenie problem with bitcoins:

Bitcoins don’t serve any useful purpose.

(And just in case it needs to be formally articulated: Stroking nerdy egos is not a “useful purpose”.)

Money, by definition, is a medium of exchange. In and of itself, money is perfectly useless. It is useful to the degree that it helps exchange goods and services for other goods and services.

Hence my two key observations regarding bitcoins—which are my key objections to it as well:

  • There is currently no market where you can buy any mundane good or service exclusively and necessarily with bitcoins.
  • There is currently no market where you can sell any work or service that you provide, or for any good you wish to sell, exclusively and necessarily with bitcoin.

(Also, actually acquiring bitcoins is remarkably complex—and completely negates the supposed anonymity of bitcoin. Here’s a Reddit editor discussing how tough it was for him to get bitcoins, which is fairly typical of retail customers: A whole lot of hassles, and he still couldn’t buy any. And for all the talk of “bitcoin’s anonymity”, you need a whole truckload of verifiable documents making clear who you are in order to buy your first bitcoin. So the bitcoin-anonymity argument is a chimera.)

The failure to meet that condition—“buy or sell exclusively and necessarily with bitcoin”—is what makes bitcoin essentially useless. Some people are touting that you can buy airline tickets with bitcoin: Sure—but so what, last I checked, all airlines are still accepting U.S. dollars. When airlines beging accepting bitcoins exclusively and necessarily, well then . . . but that day won’t come.

The fact is, bitcoins did have an imminently practical application, a market that exclusively and necessarily required bitcoins in order to participate: Silk Road, the online illegal drug market. Before Silk Road was closed by the government, you could buy weed or smack with a bitcoin or two—which was not only great if you wanted to get high, but also allowed bitcoins to behave as a currency is meant to behave: As a medium of exchange.

But since the closure of Silk Road, bitcoins have no raison d’être. Bitcoins have become a good in and of themselves, not a medium of exchange. I would go so far as to argue that the very fact that so many bitcoins bought you so many ounces of hash or so many pills of X prevented the deflation of bitcoins—i.e., the speculative mania in bitcoins—that we have been seeing over the last couple of months. The closure of Silk Road freed bitcoins from its task of being a mechanism of exchange, and allowed it to become what it is today:

Tulips.

Right now, bitcoins are rising against the dollar so precipitously—or in other words, deflating so abruptly (see chart below)—or in still other words, there is such a speculative mania in bitcoins—that even if there was something you could exclusively and necessarily buy with a bitcoin, only a fool would actually spend one on that good or service. I mean it has actually gone up over 1,000% over the last month.

Bitcoin price and volume chart.
Click to enlarge.

Hence since there is nothing you can exclusively and necessarily buy with bitcoins, and since it is rising against all other currencies so radically, it pays to hoard bitcoins rather than to spend them—and thus they automatically become a speculative good.

In other words, again, tulips.

Accepting for the moment that bitcoins might become a de facto currency for some market or other, its deflationary behavior over the last few months is an excellent argument as to why currency deflation is such a bad thing to an economy, arguably worse than inflation: The currency is hoarded, on the expectation that goods and services will become cheaper over time, which they do because people don’t buy and thus sellers lower their prices—thus encouraging people with cash to not buy, the economy falling into a deflationary spiral.

Bitcoin is following a deflationary spiral to a “T” . . . except for the basic fact that there is nothing to buy in the bitcoin economy except other bitcoins.

That’s why bitcoins will crash: It’s a speculative mania, folks. Every buyer of bitcoins is expecting its value to rise. And consciously or not, every buyer expects that in the future, there will be someone willing to pay more dollars for the bitcoins they have than they themselves paid out for them.

Consciously or not, every bitcoin owner is waiting for the greater fool.

Once the market for bitcoin buyers realizes that there are no more fools—or that the last holders of bitcoins are the last fools of the market—the value of bitcoins against other currencies will crash just as swiftly as it has risen. Faster, even.

So here’s the bottom line:

—If you don’t have any bitcoins, don’t get any. It’s going to crash—the “when” of course being impossible to predict, but as inevitable as the collapse of any speculative bubble.

—If you currently have bitcoins, then follow Joseph P. Kennedy’s very wise advice: “Only a fool holds out for top dollars.” If you’ve made some money on the run-up in Bitcoins, take the profits and count yourself lucky. If the bubble continues to rise, so what, you made your money. Better to sell too early than too late.

Without Silk Road, bitcoins are nothing but tulips. And tulipmania ended in tears for some, laughter for others.

Be the one who’s laughing when it all crashes.


The Value of Bitcoin- One Perspective

Here is one perspective on the value of Bitcoin. Although I continue to think that Bitcoin is likely in a bubble and that the disruptive potential of the alternative currency remains limited due it being plugged into the established currency value chain, I think the architecture of the transaction and ledger system has substantial value.


Volume Off the High- Dec. 2 Trading Day Edition

Not many names coming off their highs with the decline in the market. But still, 3M coming off after a downgrade cannot be a good sign.


High Volume High- Dec. 2 Trading Day Edition

A few larger names moving in yesterday's trading.


Back to the Grind- S&P 500 Price/Volume Heat Map for Dec. 2

The S&P 500 spent most the day yesterday grinding it out. After trading flat to slightly higher most of the trading day, the market closed lower on accelerated volume levels into the close. Although the accelerated volume, indicating distribution, total volume on the day was light.


The same can be said about the price/volume heat map indications, showing that supply/demand was more or less balanced. That is outside of telecom and discretionary. Although I remain bearish, there is nothing I am seeing that says the upturn will be interrupted in the short-term.