In the last trading day of week, the S&P 500 soared, gaining about 110 basis points, after an apparently good jobs report was released. However and as I will detail later, the number of employed people continues to show negative acceleration versus the same period last year. More so, I think Friday's move was more of a relief rally that followed days on continued equity price losses. The data table below shows the extent of the snap back.

Additionally, the price/volume heat map shows that extent of the volume gains and demand experienced across most of the market. That is except for some pockets of losses in the energy sector.


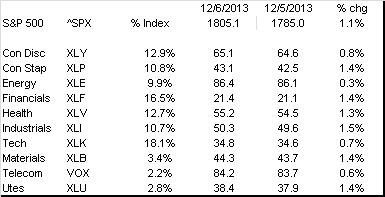
Week ending Dec. 6
Looking at the weekly figures, bears out that Friday's rally was more of a reversion to the mean event, as the S&P 500 essentially ended flat.

More so, the weekly supply/demand dynamics were muted at best. Technology shares showed some signs of strength on the trading week. The same goes for staples. This was while discretionary and energy shares saw an influx on the supply side. The latter was probably due to negative sentiment building for the retailers and talk of bloated holiday inventories.


No comments:
Post a Comment