For the latest ended trading day, the S&P 500 added roughly 40 basis points in value. Additionally, Friday's gains were the largest contributor to the weekly gains of about 50 basis points. Despite the price gains, the overall volume levels were weak, suggesting further downside in this pressured market environment.

Overall but outside of telecom and utilities, the price/volume hear maps suggests a rather even supply and demand mix on the market. I would not expect anything less considering the slow trading environment heading into a pre-holiday week.


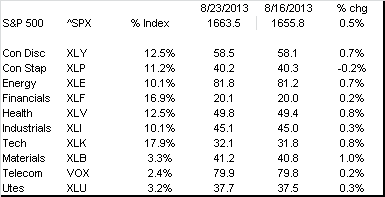
For the Week Ended 8/23
a

The price/volume heat map largely reflects similar supply and demand dynamics seen in Friday's trading. That said, the staples sector saw some selling pressure on the week.


Overall but outside of telecom and utilities, the price/volume hear maps suggests a rather even supply and demand mix on the market. I would not expect anything less considering the slow trading environment heading into a pre-holiday week.

For the Week Ended 8/23
a
The price/volume heat map largely reflects similar supply and demand dynamics seen in Friday's trading. That said, the staples sector saw some selling pressure on the week.

No comments:
Post a Comment