Still exposed to the S&P 500 on a one-for-one basis, the VIX-Trading Portfolio gained 2.1% on the week. This is roughly inline with the 2.2% gain on the S&P 500 index. The latest gain on the week leaves the portfolio up by 6.8% on the year, for about a 2 percentage loss relative to the market, and up 4.9% since inception, the later representing a detriment of 5.2 percentage points relative to the S&P 500. All of this is reflected in the chart below.

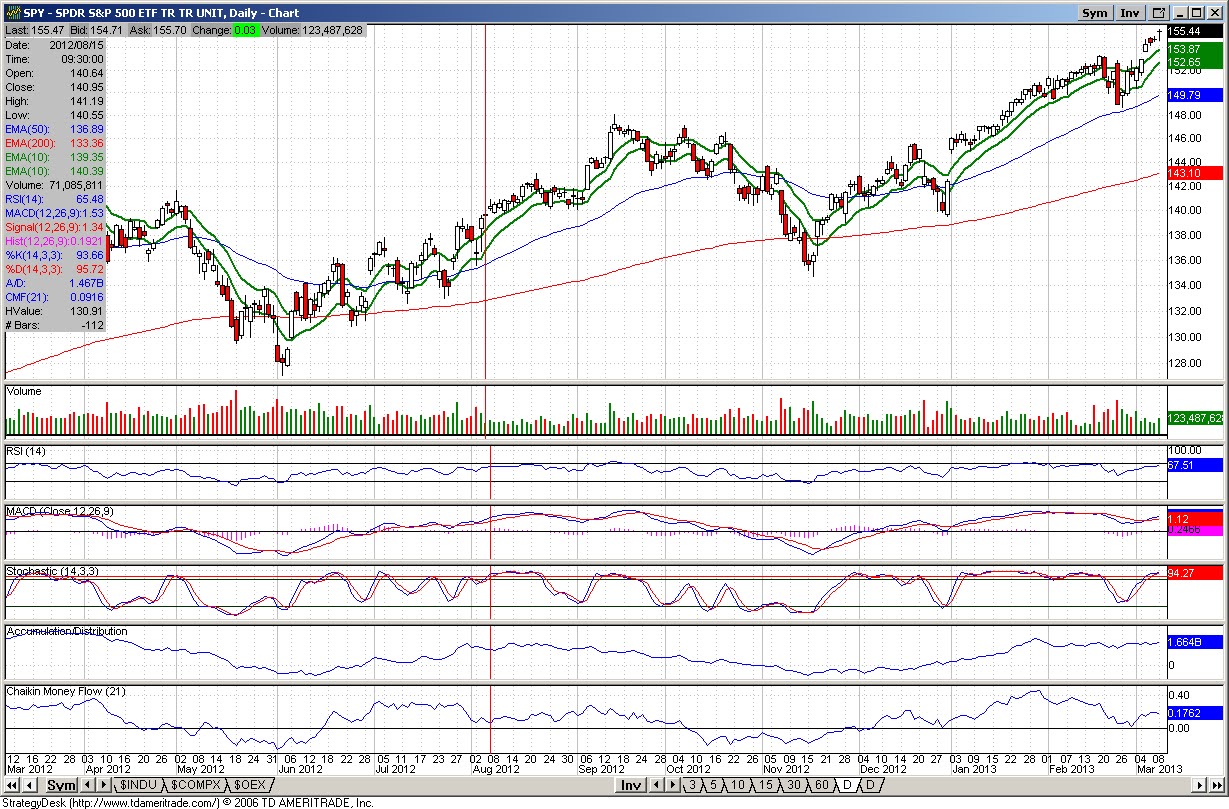
Despite the mechanical model turning positive on equities early last week, I am remain cautious on the index. My trepidation stems from a combination of technical indicators and what I see as weak fundamental underpinnings. Technically, a number of indicators are flashing caution signals, which can be seen below.

What stands out to me is the divergences in the MACD, RSI, and money flow indicators relative to the price. This suggests to me that the upside momentum is waning and that investor demand is tepid. What also stands out is the weakening volume dynamics. Since the S&P 500 broke out last week, volumes have been weak. This can also seen in the Price/Volume Diffusion Index, albeit still positive, which has turned down in recent trading sessions.
Fundamentally and without getting into all the details here, the number of companies cutting dividends, the anemic year-on-year growth in GDP, and the weakening acceleration/deceleration in employment all point to higher recessionary risks.
Despite these concerns, I still think the trajectory for equities prices is up in the short-term. The Price/Volume Diffusion Index remains positively positioned. Additionally, the standardized VIX data suggests higher equity prices. The current standardized VIX is -1.4 while the weighted average standardized VIX (a less volatile measure than the daily calculation) is just a tad greater than -2. The move over -2 in the latest week is what triggered the quantitative buy signal in the model. One final note on the standardized data, the skew, while still negative, is creeping closer to positive results. On a shorter-term basis, there is a positive discrimination between negatively and positively skewed data, meaning negatively skewed VIX data is typically followed by better equity price performance versus positively skewed data. The trend can change, but skew has been sliding towards the 0 demarcation for a few weeks now.

Despite the mechanical model turning positive on equities early last week, I am remain cautious on the index. My trepidation stems from a combination of technical indicators and what I see as weak fundamental underpinnings. Technically, a number of indicators are flashing caution signals, which can be seen below.
What stands out to me is the divergences in the MACD, RSI, and money flow indicators relative to the price. This suggests to me that the upside momentum is waning and that investor demand is tepid. What also stands out is the weakening volume dynamics. Since the S&P 500 broke out last week, volumes have been weak. This can also seen in the Price/Volume Diffusion Index, albeit still positive, which has turned down in recent trading sessions.
Fundamentally and without getting into all the details here, the number of companies cutting dividends, the anemic year-on-year growth in GDP, and the weakening acceleration/deceleration in employment all point to higher recessionary risks.
Despite these concerns, I still think the trajectory for equities prices is up in the short-term. The Price/Volume Diffusion Index remains positively positioned. Additionally, the standardized VIX data suggests higher equity prices. The current standardized VIX is -1.4 while the weighted average standardized VIX (a less volatile measure than the daily calculation) is just a tad greater than -2. The move over -2 in the latest week is what triggered the quantitative buy signal in the model. One final note on the standardized data, the skew, while still negative, is creeping closer to positive results. On a shorter-term basis, there is a positive discrimination between negatively and positively skewed data, meaning negatively skewed VIX data is typically followed by better equity price performance versus positively skewed data. The trend can change, but skew has been sliding towards the 0 demarcation for a few weeks now.
No comments:
Post a Comment