The following chart has been making its way across the blogosphere and creating some controversy...
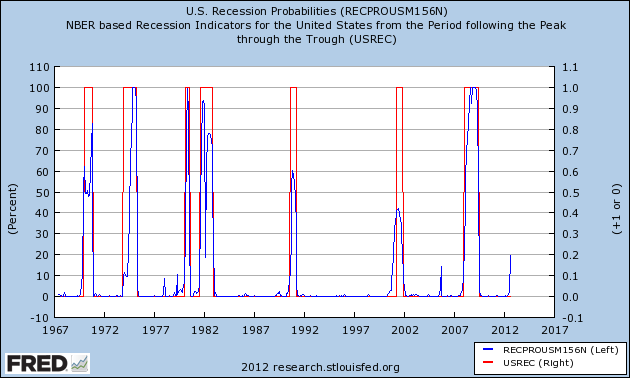
The idea behind the chart analysis is that it measures the probability of a recession and that every time the indicators have achieved the 20% level, a recession always follows. To be be honest, this chart or the research behind it has never been on my radar as something to watch except for in recent days. So I really cannot side with any one argument or the other (at this time), as it pertains to the chart analysis. That said, I continue to believe that we will see a slow down in job growth and employment gains come 2013, as the implementation and costs of the healthcare law suppress business investment and employment. Will this lead to a recession? That is a possibility. In my mind it will, at least, lead to a continuation of sub-par economic growth.
In any event, here are some posting on the subject that can help you make up your own mind.
Some posts in highlighting the risks the chart implies
- Political Calculations
- Reformed Broker 1
- Reformed Broker 2
- A critique from A Dash of Insight
- The original research
No comments:
Post a Comment