Wednesday, April 3, 2013

Watching the Small Caps

I am watching the small cap stocks as a measure of equity investors propensity to send the entire market higher. Although the large-cap indexes (S&P 500 and the Dow) traded higher in yesterday's trading, small caps did not participate. In face, the Ishares Russell 2000 ETF (ticker IWM) not only did not participate in the rally, it broke the uptrend that began in November on increasing volumes. This is one to watch


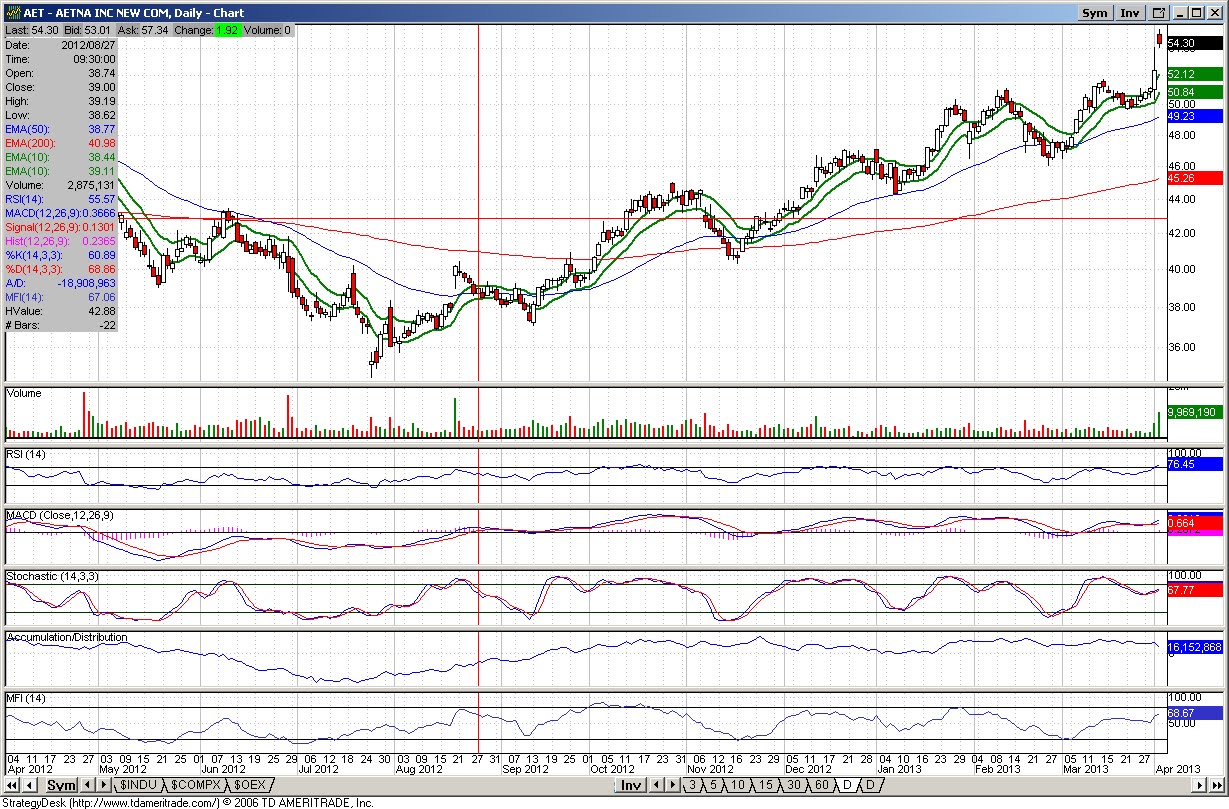
High Volume High 4/2 (Insurance) Edition

If airlines was the theme in new high volume sell-offs, insurance is the theme in new high volume highs.


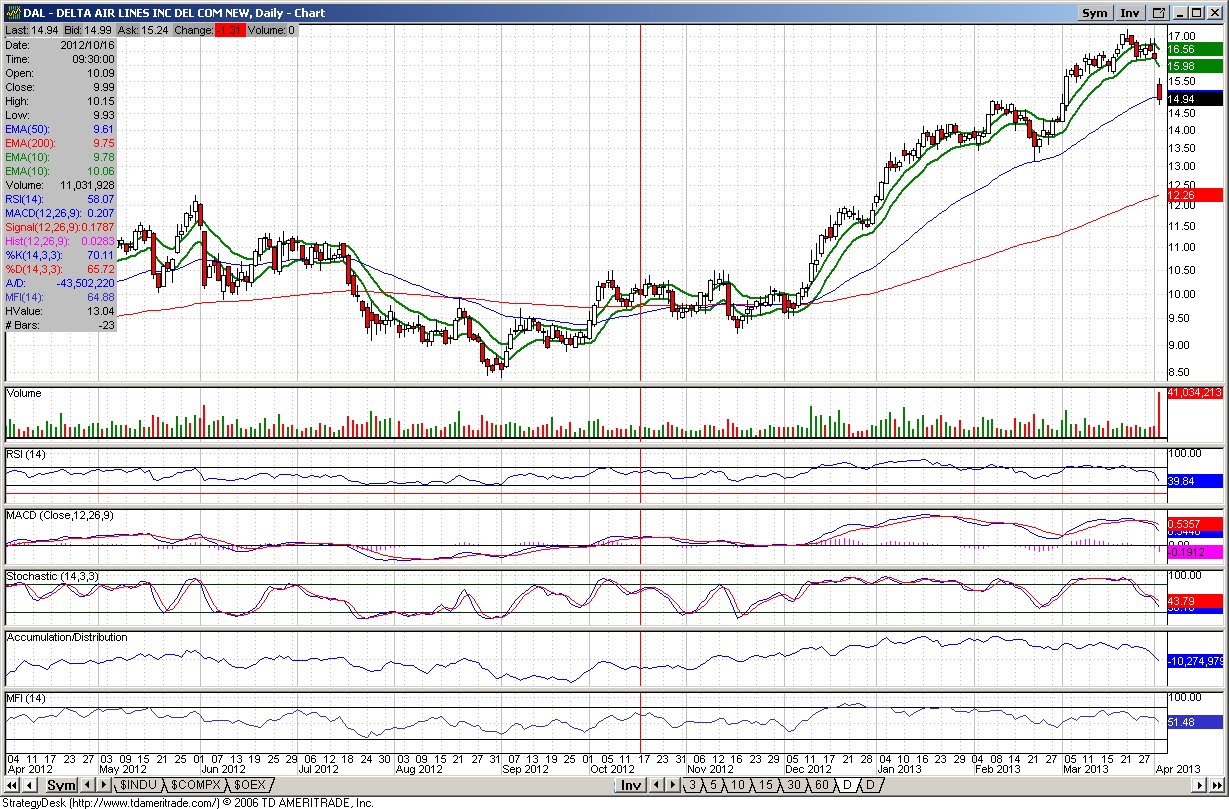
Volume Off the High 4/2 (Airline) Edition

Just about every airline hit the screens and/or made the list based on yesterday's trading.....


The True Science of Parallel Universes

Tuesday, April 2, 2013

Higher Risk Equities Not Leading the Charge- Part 2

There is definitely more work for me to do here. For instance, recreating both the Powershares S&P 500 High Beta ETF (ticker SPHB) and the Powershares S&P 500 Low Volatility ETF (ticker SPLV) using historical index data and pricing in order to see if the same relationship holds prior to 2011. In the meantime, the relationship I briefly touched upon here is looking more interesting as I dissect the data.

For instance, the trend in the relative price of the SPHB/SPLV and the S&P 500 appears to be all important. To discern the trend of each, I calculated a 3-month and 6-month slope for each and compared them to each other. The results are shown below.

3-month slopes


6-month slopes


What appears interesting here is the rather tight relationship (actually the correlations of each are over 80%), except for the period starting in November 2012 through about February 2013. It is my opinion that the uncertainty surrounding the fiscal cliff likely held down the market's valuation and price, which now looks like it has fully caught up. However, it appears we are seeing another dynamic beginning to play out, as less-cyclical/ less-risk equities are leading the rally. This could be a troubling scenario, especially considering today's Wall Street Journal report discussing that negative preannouncements are outpacing positive preannouncements by a more than 3-to-1 margin.

Al That Glitters is Back in the Strong Buy Range

I was all set to report on another benign update on gold/precious metal stock timing models through the end of last week, but the market would have none of that. The decline in the price of gold today has provided long-term investors, in my opinion, another shot at great entry point into gold-related mining stocks at attractive prices.

Before I get into the models,  I think it would be appropriate to update you on the my forecasts for money supply. As you may you know, the timing models I employ use money supply as significant input. However, any casual observer of the money supply figures released by the Federal Reserve knows they are reported with a two week lag. That stated, I use a combination of Federal Reserve balance sheet data, trend analysis, and seasonal factors to estimate money supply through the present two weeks. What I have not stated is that I will also forecast money supply figures further out, usually on monthly basis and other discrete points in time to create various scenarios. This is one of those times.

The timing models up through the end of last week remained in a mid-zone, but showing a continuing weakening trend on a combination of rolling time and a price of gold that had hovered around $1,600. In fact, the 1-year model stood at -1.6 and the 6-month model was a -1.2, off from a respective -2.35 and -1.9 just over a month ago.

This all changed today. The decline in the price of gold towards the mid $1,500 range has pushed the attractiveness of gold stocks back up into a stronger buy territory. My assumption is that money stock will decline slightly from the March 18 figures but rebound strongly in the first week of April. Using my estimates for money supply and the recent price of gold yields the following timing model results.

3-Month Model, -1.6


1-Year Model, -2.2


6-Month Model, -1.8


The combination of a 1-year model and 6-month model at similar extremes has provided significant upside and risk control attributes in the historical context. Seeing this and other setups, I deployed further capital into the gold/precious metals stocks in today's trading.