The market took a marginal turn down in yesterday's trading, with the S&P 500 falling by about 20 basis points on a mixed signal trading day. The final results followed a choppy trading market where the S&P 500 traded up briefly in morning trading, but spent the rest of the day in the red. However, a late day surge helped alleviate the negative results.

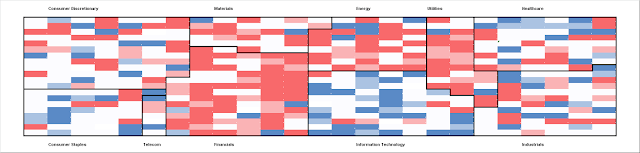
For the most part, trading was choppy. Overall volume levels were light while the supply and demand was all over the map, as evidenced by the price/volume heat map results below. Tech, on a relative basis, experienced strong demand inflows, and overall weak supply side dynamics. In contrast, utilities were sold across the board on high amounts of supply coming to the market. Ditto can be said about the financial sector. i wonder if the latter two moves are providing any indication or outlook on interest rates?


For the most part, trading was choppy. Overall volume levels were light while the supply and demand was all over the map, as evidenced by the price/volume heat map results below. Tech, on a relative basis, experienced strong demand inflows, and overall weak supply side dynamics. In contrast, utilities were sold across the board on high amounts of supply coming to the market. Ditto can be said about the financial sector. i wonder if the latter two moves are providing any indication or outlook on interest rates?


No comments:
Post a Comment