Saturday, January 26, 2013

Long-Value Portfolio Update for Week Ending 1/25/13

The Long-Value Portfolio lost marginal ground to the market this week, gaining less than 1.1% versus the S&P 500's 1.14% increase. The gains were fairly broad-based throughout the portfolio with the discretionary, financial, energy, and tech sectors leading the gains, which offset relative losses in the staples and industrials groups. On a stock basis, the largest contributing outperformers were Cash America (up 15%), Krispy Kreme (gaining more than 7%), and Key Energy Services (up 10.5%). The largest contributing drags on portfolio performance were Nash Finch (down 3.6%), IIVI (down more than 10%), and Joy Global (falling more than 8%).

The following is the latest updated chart for the portfolio versus the S&P 500 and the NASDAQ

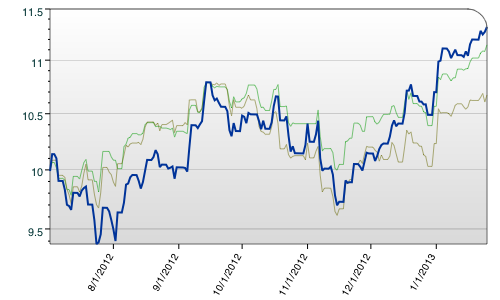
Year-to-date, the portfolio has gained 5.8% or 40 basis points more than the S&P 500. Since inception, the portfolio has gained more than 13% or 410 basis points more than S&P 500.

Short-Trading Portfolio Update for Week Ending 1/25/13

Apple is the word this week. Apple's stock was the predominate reason the the Short-Trading Portfolio gained 1.6% this week or 50 basis points relative to market. The remainder of the short recommendation/holdings in the portfolio had mainly frictional gains or losses. The gain from AAPL is evident in the chart below.

The portfolio's performance remains below the S&P 500 (green line) but has slightly eclipsed the NASDAQ (brown line) in the week. Year-to-date, the portfolio has lost 2.1% versus the 5.4% gain on the market. Since inception, the portfolio is up just 80 basis points for a loss of 2.1% relative to the market over a similar time frame.

Long-Trading Portfolio Update For Week Ending 1/25/13

The Long-Trading Portfolio has been bounding around in value for a number of weeks now, being primarily invested in a number of coal stocks. For the most recent week, the portfolio lost 2.4% in value versus the 1.1% gain in the S&P 500. This is seen in the below chart with the blue line representing the portfolio and the green and brown lines being the S&P 500 and NASDAQ, respectively.

Year-to-date, the portfolio is down 3% versus the market's gain of 5.4% but is up 9.8% (6.4% on a relative basis) since inception. I know I have been on a drought on finding long names, but I am looking into a number of names that could be interesting investable candidates.

Friday, January 25, 2013

Japan Rejects Notion of Currency War

A war, in my mind, may be stretching a bit at this point...... more of a race to the bottom.


A battle over the direction of monetary policy intensified on Wednesday as Japan denied accusations that it was trying to revive its economy at the expense of its trading partners.
Referring to the Bank of Japan’s move to ultra-loose monetary policy and similar action by other central banks, Axel Weber, former Bundesbank president and now chairman of UBS, warned that the spread of the approach was “heading into dangerous territory”.

Mr Weber, speaking at the World Economic Forum in Davos, said that the current generation was “living at the expense of future generations” because monetary policy was encouraging people to pull out all the stops to continue consuming heavily. “We are trying to keep a speed limit for our economies that is simply unsustainable,” he said.  

The debate on whether monetary policy could do more to boost growth or whether further action would have negative side effects came as International Monetary Fund forecasts again suggested the world recovery would be slower than previously hoped.

Mr Weber’s comments echoed concerns in China and at the central banks of Germany and the UK that Japan’s move to an ultra-loose policy was a bid to drive down the value of the yen that could lead to retaliation from other countries also seeking to boost the pace of recovery through stronger exports.
China’s official Xinhua news agency said on Tuesday that Japan’s “decision to crank up money printing presses is dangerous” and might lead to “currency wars”.

Sir Mervyn King, Bank of England governor, said on Tuesday that if a number of countries sought to lower their currencies it would be “hard to be optimistic about how easy it will be to manage the resulting tensions”.
Jens Weidmann, the Bundesbank president, meanwhile, had described Japan’s new government’s pressure to make the BoJ more proactive as an “alarming infringement” of central bank independence that could lead to “politicisation of the exchange rate”.

Japan hit back at Mr Weidmann on Wednesday. Akira Amari, economy minister, told the Financial Times: “Germany is the country whose exports have benefited most from the euro area’s fixed exchange rate system. He’s not in a position to critwicise.”

Mr Weber’s concerns over monetary policy were supported by Nouriel Roubini of the Stern School at New York University, who had backed the initial moves towards unorthodox policies such as quantitative easing in the financial crisis. “We must care about it,” Prof Roubini told delegates in Davos.

However, Japan’s position received support in the Alpine resort from those who see the use of unorthodox monetary policy across the world as necessary given the extreme weakness of the recovery.

Stanley Fischer, governor of the Bank of Israel, said policy makers were still in a good position to rein in any inflation or other negative consequences of the ultra-loose policy. “Central banks retain [the] capacity to intervene – they can sell a lot of assets and don’t lose the capacity to affect interest rates.”
Adam Posen, director of the Peterson Institute of International Economics, said it was absurd to “hold the deep spiritual belief that QE must end up in inflation”.

Gold/Gold Stocks Remain Weak/Downside More Probable

Gold stocks took it on the chin today's trading, as the the Market Vectors Gold Miner ETF (ticker GDX) fell by 3% on elevated volume. In fact, the volume levels, $32 million, was one of the highest turnover rates we have seen in the last twelve months. This caps three days of selling (and for those looking at patterns, the set up could be a three black crows, a supposedly ominous signal. I am one not to really look at patterns per se, more so the price and volume trends to get a sense of the supply and demand.), and I think the selling pressure and price/volume setup could suggest a move to the May '12 lows is a higher probability event. I provide the chart of the GDX below.


I also think that the price/volume action in the GDX suggests that the price of gold is going lower. My research has shown that the price of the gold miner indexes leads the price of gold by a factor of a few weeks to a few months. This is probably due to, in my opinion, stock investors being a more forward looking bunch. The Spider Gold Trust (ticker GLD) has been trading in a sideways pattern since mid December and has traded up into the December 18th downdraft twice, failing both times. I would not rule out another test of this level, but also think the repeated failures at this juncture suggest operators testing the market's supply while seeing if there is any demand for higher prices. The repeated failures in conjunction with the weakness in the GDX leads me to weigh the downside as a more probable outcome..... which would not be a bad thing if you are looking to buy more gold stocks or gold. I know I am sitting on my hands.


Sitting On Your Hands With All That Glitters

Sometimes, sitting on your hands is the best policy. Especially when keeping to a strategy. I say this as was contemplating, a few weeks ago, adding to positions in gold stocks. This is when the indicators were approaching the -2 level, but just quite did not reach that 'magical' level. I am so glad I didn't bite and stuck with my guns of sitting on my hands. The models were not indicating a strong buy, nor was a sign of strength in the gold stocks. Over the last few days, the air under the group has come out and the price of the Market Vectors Gold Miner ETF (ticker GDX) has fallen to the low $40's from about $45 per share.

Now, the gold stocks have broken their support, on volume. Not only does this indicate to that gold stocks are going lower, but it also suggests to me that the price of gold will likely follow. But that discussion is for another post.

Turning to the models, the timing indicators remain in mid buy range. This is despite a fall in per ounce price of gold in the last week, down more than $29 per ounce for the shiny metal. Offsetting this decline was a $70 billion draw down in the money stock, in my estimation largely due to seasonal factors. As I have mentioned in prior All That Glitters posts, money supply tends to decline in the first weeks of the year on a week-over-week basis. This year appears no different.

The 3-month model has been bouncing around a bit and is presently sitting at a -1.14.


The 1-year model is currently a -1.38, roughly the same place it has been for the last month.


As for the 6-month model (which if you remember if what I use as the anchor of my timing decisions) is currently at a -1.43.  Just like the 1-year model, this too has largely stayed in this area for the last month or so.


I remain on the sidelines waiting for a better entry point.