Via Art Cashin,
For why that annual reading may be important, let me quote my Bloomberg pal, Rich Yamarone:
(Source-Zero Hedge)
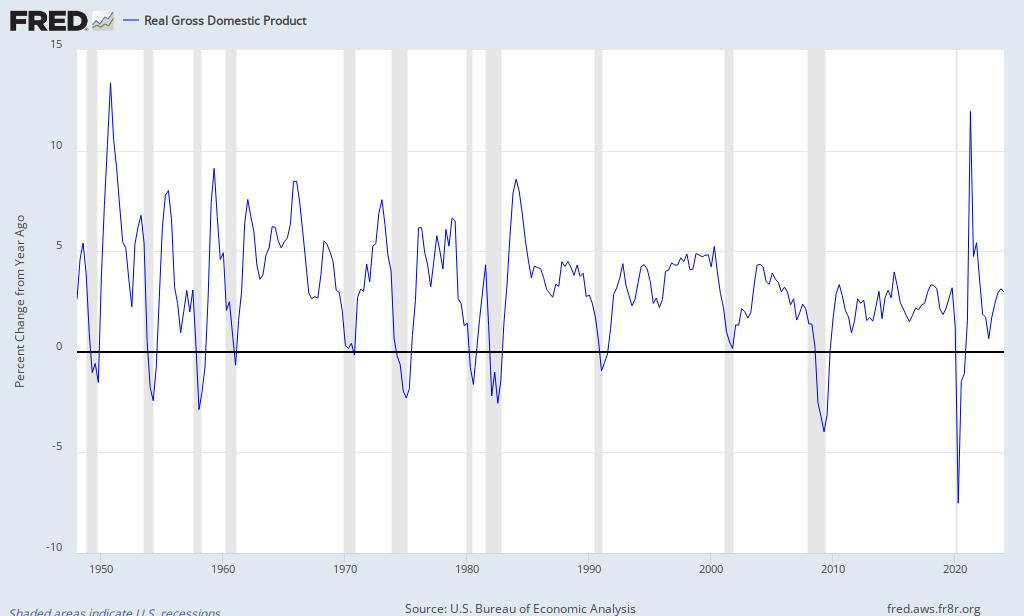
The conventional wisdom may be on to something here. Just look at the chart below. It appears that a year-over-year increase of GDP of just 1.5% or less is a decent precursor to a recession. Additionally, the data bears this out, as the median year-over-year GDP gain is just over 3% while the combination of decelerating, sub-par growth results in a median three quarter change in GDP of just 0.3%. This leads credence to the theory that recession risks are increasing.
For why that annual reading may be important, let me quote my Bloomberg pal, Rich Yamarone:
Patterns can always change of course let but that one's got a rather compelling historyThe year-over-year change in real GDP was 1.5 percent. There has never been a time since measurement commenced in 1948 when the annual pace of real GDP has fallen that low without the economy ultimately slipping into recession. Sub-2.0 percent readings are historically the warning signal.
(Source-Zero Hedge)
The conventional wisdom may be on to something here. Just look at the chart below. It appears that a year-over-year increase of GDP of just 1.5% or less is a decent precursor to a recession. Additionally, the data bears this out, as the median year-over-year GDP gain is just over 3% while the combination of decelerating, sub-par growth results in a median three quarter change in GDP of just 0.3%. This leads credence to the theory that recession risks are increasing.


