Does this mean we start to go higher..... we shall see.
Tuesday, December 31, 2013
Must Be All Those Green Initiatives
I have not talked about the recent (and apparent) surge in economic growth, but my and others (Rickards, Zero Hedge, 24/7 Wall Street, Political Calculations off the top of my head) reading of the data suggest that the 4.1% growth in Q3 GDP was an aberration and unlikely to repeat. More so, I continue to question the veracity of economic growth in general, as dividends continue to be cut and employment growth continue to wane. We can add another objective measure to the list of data suggesting that economic growth is a lot weaker than otherwise assumed.
Te below chart shows the year-on-year change in GDP versus the 6-month rolling average in the year-over-year change in electricity use by commercial, industrial, and residential users in the US.

Although electricity demand has a lower beta, electricity use and economic growth generally move in tandem, as higher (lower) economic growth precludes growth in businesses, production, and an overall increase in energy use. Looking at the above chart, you should see the relationship between electricity usage and economic growth. Since mid-2012, electricity usage has remained largely negative. More so, usage has shown a renewed downturn. On question, how can economic growth be accelerating while energy use has been falling. Must be all those green initiatives right?
Observations On Gold, QE, and the Tapering- Rickards
The following is an interview with Jim Rickards with the Swiss-based Physical Gold Fund

All That Glitters Remains Risky
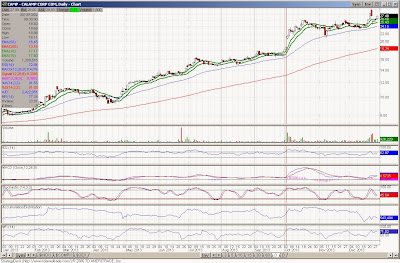
In the last few weeks, the timing models I employ and talk to you about have seen relatively little change. This is as the price of gold equities have trended sideways for most of December and gold prices have trended back toward the lows of the year. In conjunction with these price moves, money supply growth has apparently accelerated over a rolling 3 month time span. All in, this has pushed the timing models deeper into a buy zone. Just see the below.
6-Month Model, -1.8 currently versus -2 last week and last month.

1-year Model, -1.5 versus -1.6 and -1.5

Long-term Model, -1.9 versus -2 and -2

Although the timing models remain in the buy zone across the board, the risk model remains weighted towards higher risk with a measure below -1.
Risk Model

As long as the risk model remains below -1, the risk for gold equities remains weighted towards the downside. Before committing anything but long-term capital to the group, I would wait for a significant sign of strength in the gold equity complex on a price/volume basis and/or an improvement in the risk model to a level above -1.
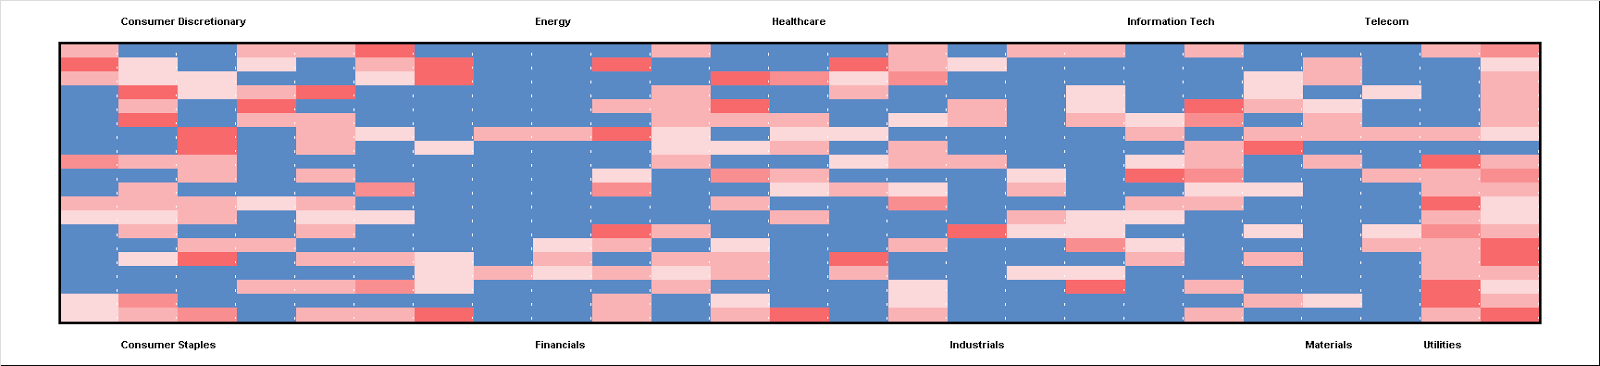
S&P 500 Price/Volume Heat Map Dec. 30
In still light trading yesterday, the market essentially flat. As you could imagine, overall volume levels remain light and price performance across the sectors were mixed.

Not much can be discerned from the price/volume heat map. Energy shares gave up some of the demand seen in last week's trading.


Not much can be discerned from the price/volume heat map. Energy shares gave up some of the demand seen in last week's trading.


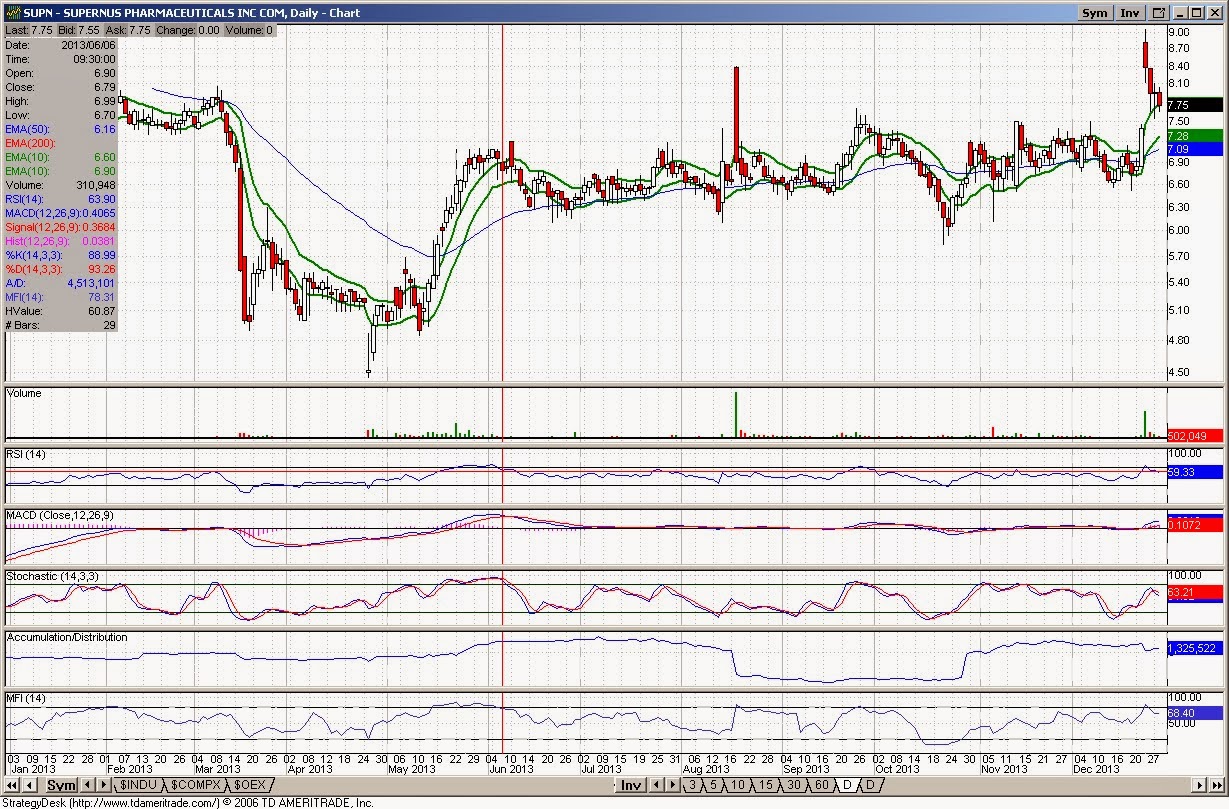
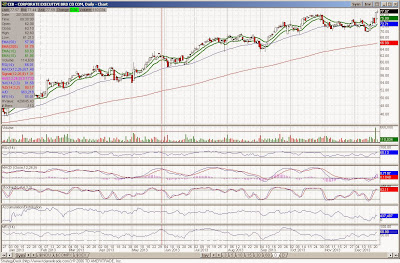
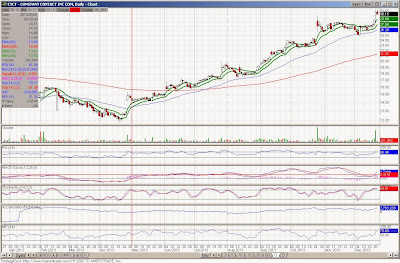
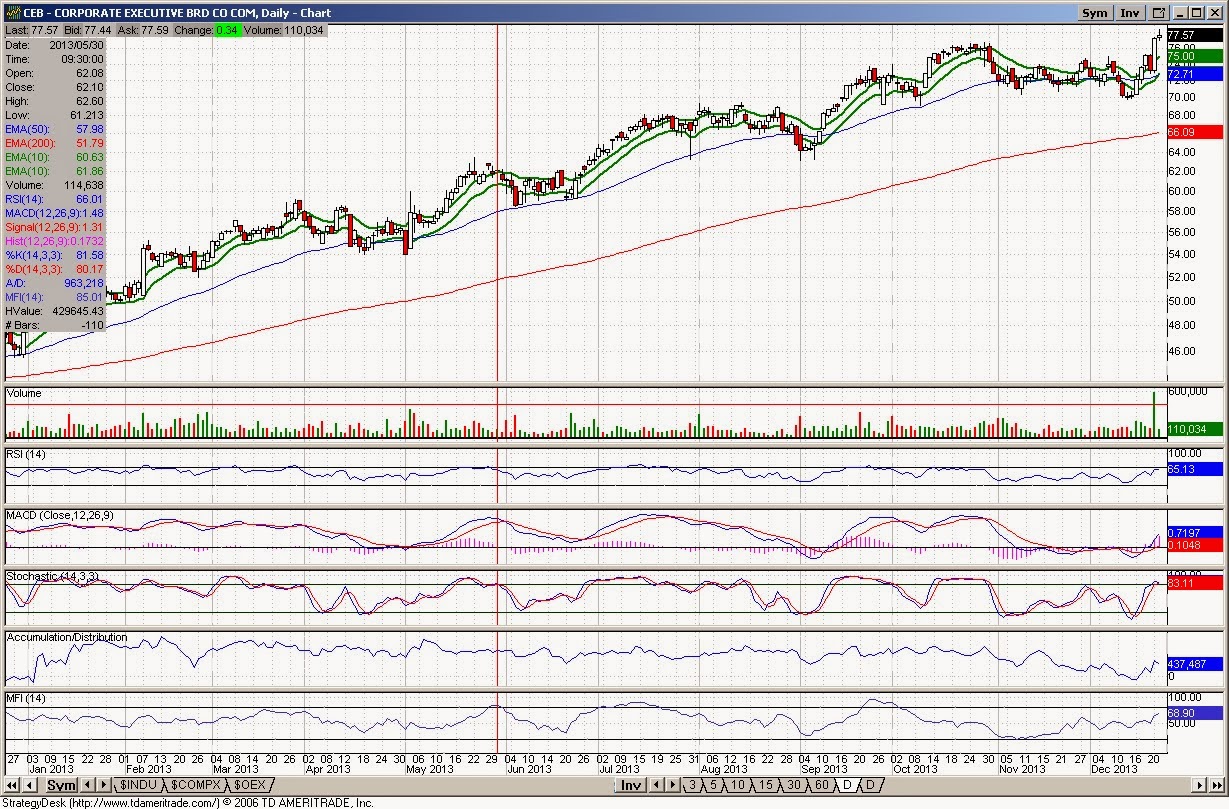
High Volume High- Dec 30 Trading Day Edition
Just one lonely name here. Strangely, there was no apparent news on the company, but volume far outpaced anything in the last year.


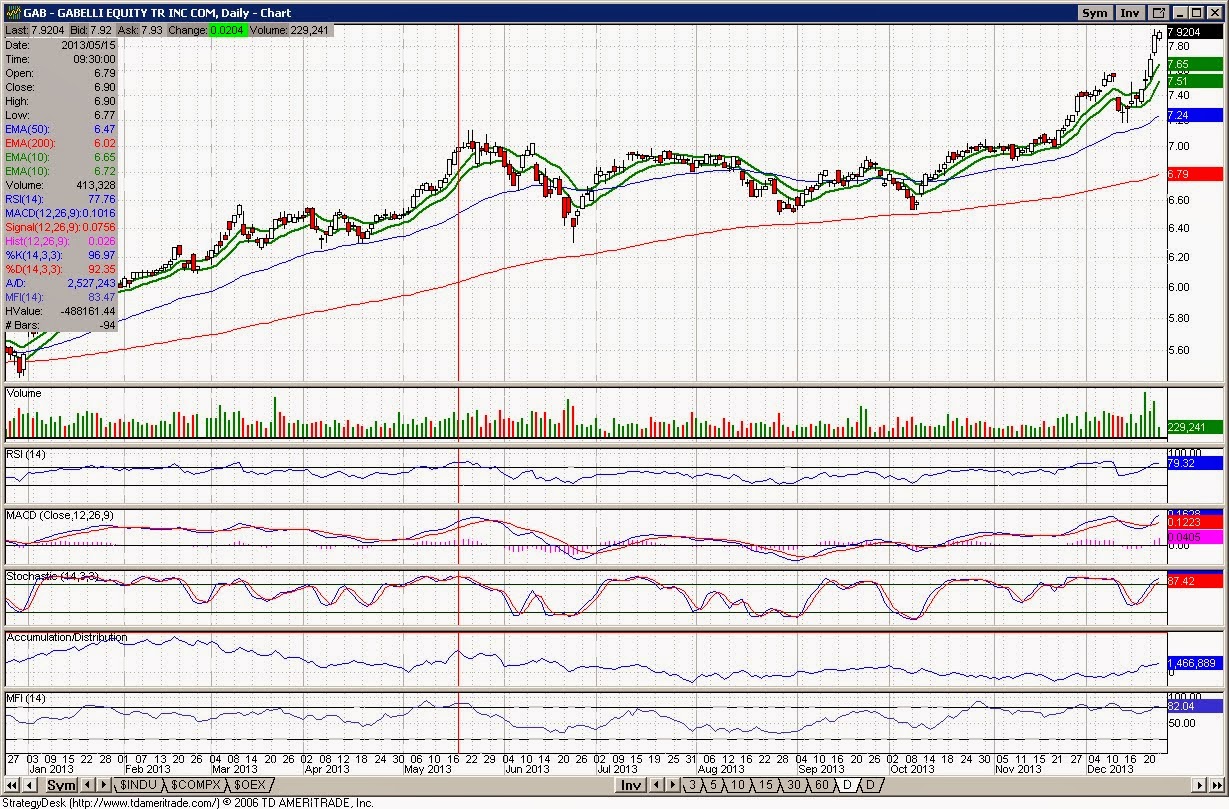
Volume Off the High- Christmas Eve Through Dec. 27 Edition
An abbreviated list of names coming off the highs with volume during the light trading week.


S&P Price/Volume Heat Map For Dec. 27 Trading Day and Week
And yet one more Price/Volume heat map post with little comment, with lite overall holiday trading.

Outside of energy, can't say much was going on here on the long or short side.


Week ending Dec. 27

For the week however, demand and price gains were more robust.


Outside of energy, can't say much was going on here on the long or short side.


Week ending Dec. 27

For the week however, demand and price gains were more robust.

S&P 500 Price/Volume Heat Map For Dec. 26
Again, presented for continuity and with little comment.

Sans utilities, supply and demand was weighted to the positive side, more or less.


Sans utilities, supply and demand was weighted to the positive side, more or less.


High Volume High- Christmas Eve to December 27 Edition
A list of some names making new highs over the holiday trading week between Christmas Eve and December 27.


S&P 500 Price/Volume Heat Map for Dec. 24
Presented with little comment considering the holiday trading, but posted for continuity.

The supply/demand balance was generally mixed.


The supply/demand balance was generally mixed.


Bloomberg- Twelve Years of Little Tyrannies in Two Minutes
Delving into the political/libertarian scene more a moment with Reason TV.
Tuesday, December 24, 2013


Over the High- S&P 500 Price/Volume Heat Map Dec 23
Although volume was incredibly light, it really does not matter as we moved over the highs on the S&P 500. Prices over the highs suggests we are going higher. This follows the market's roughly 50 basis point gain in yesterday's trading, an increase predicated on the strength in financials and technology shares.
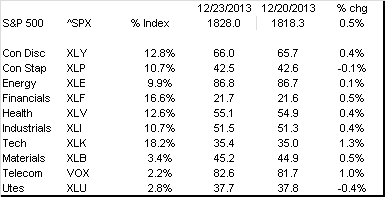
The demand looked positive, more or less, in aggregate during yesterday's trading, as more than 50% of sector groups showed stronger price/volume characteristics.


The demand looked positive, more or less, in aggregate during yesterday's trading, as more than 50% of sector groups showed stronger price/volume characteristics.


Monday, December 23, 2013
Price/Volume Diffusion Index Still Points to Higher Equity Prices
It has been awhile since I updated this publicly and I wanted to provide you a quick update. My Price/volume Diffusion Index (PVDI, which tracks the trend in the intersection of price and volume levels in the S&P 500, continues to point towards higher equity prices. Currently, the PVDI sits at a demarcation just above the 60 level. Typically, PVDI's above 50 have usually been followed by equity prices that are higher some months out.

More so, the summation index or an index of price volume levels that feeds into the PVDI also continues in an uptrend. This index tends to follow equity prices more so than the PVDI but can be used as confirmation for moves in equity prices.

However, the strength in the upward move continues to peter out. This is as the rolling slope of summation index continues to fall off. A fall in the slope of summation index could be an early warning but I would remain with the premise that the PVDI continues to point towards higher prices, as the the index remains elevated and the summation index trend remains positive.


However, the strength in the upward move continues to peter out. This is as the rolling slope of summation index continues to fall off. A fall in the slope of summation index could be an early warning but I would remain with the premise that the PVDI continues to point towards higher prices, as the the index remains elevated and the summation index trend remains positive.

High Volume High- Dec. 20 Trading Day Edition
A lot of names making the list on Friday. Strangely (and yes, the following comments comes from my own biases), there does not see to be any rhyme or reason for some of the movers on the list. More so, it almost smacks me as window dressing in some instances. However, the list is what it is.


Subscribe to:
Posts (Atom)