Friday, July 6, 2012

Traders Edge 7/6/12- Its Employment Day

As we surmised yesterday, Thursday trading was a bit erratic with volume coming in at 75% of the 30-day average. At one point, the S&P 500 spider (ticker SPY) traded down 0.8% versus Tuesday's closing price, was off just 0.1%  in afternoon, but ultimately closed down nearly 0.5%. This was despite interest rate cuts by both European Central Bank and China. We expect much of same in Friday trading.


 The market continues to trade near resistance levels. It appears overbought using the stochastic oscillator (noting that the indicator and the price trend have diverged), but looks more positive on the MACD.


The curve ball to this is that today is when the Bureau of Labor Statistics releases the monthly employment statistics, in our opinion the most over exposed, overhyped economic statistic. However, too many economists and investors put credence into this massaged and modeled monthly statistic monthly for any one investor to completely ignore. Either way, the consensus is looking for a creation of 100,000 jobs, a number that may be hard to reach considering the rise in new jobless claims in recent weeks and the slowing global economy.

Our portfolios remain defensively postured with the largest asset exposure being cash and equivalents. We remain heavily exposed to coal stocks, which have contributed greatly to performance as of late with the group catching a bid.


The group, as exemplified by the coal stock ETF (ticker KOL), appears overbought short-term, but both the RSI and MACD are more positive and rising. In addition, our long-term technical indicator is showing that the coal stocks are at or near an attractive entry point. We may see a consolidation shortly, but would expect the gains to continue with an improvement in the fundamental outlook.

As for the remainder of the portfolios, we remain exposed to precious metals and precious metal stocks, the thesis here being that continued monetary actions and/or an eventual move to a gold standard will lift the price of the precious metals and the respective stocks. We also have exposure to the dry bulk shippers, thinking that the industry is at or near an inflection point of fleet deliveries and scrap rates. We also have a small short exposure, which was taken on back in April. We had taken our principal back on the hedge and await further indications as to what direction we will take the remaining position.

Thursday, July 5, 2012

Traders Edge 7/5/12- Risk On/Risk Off

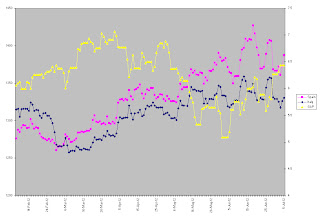
Spanish and Italian bond yields are rising this morning on continued fears and doubts about any impending reforms from the ECB and European Union. The bonds yields of the European periphery have been a decent proxy for the risk on/risk off trade on U.S. stocks, as shown in the below chart.

 The most recent decline in the S&P 500 began shortly after both the Italian and Spanish 10-year bond rates started to increase. Correspondingly but not shown, the yields on the 10-year treasury began to decline, as buyers found interest in U.S. bonds despite yields at multi-decade lows. This is likely just another volley in the race-to-the-bottom for world currencies with the bonds for the country exhibiting the least risk at any one time reaping the benefits. We would expect trade to be choppy both today and tomorrow following Independence Day, with many investors taking advantage of the mid-week holiday to extend the weekend.

The risk on trade was alive and well in July 3rd trading, with the S&P gaining 8.5 points or 0.62%. Gold gained 1.5%, silver was up 2.8% while the XAU gained 3.7%. The Dow Jones UBS Commodity index gained nearly 2.7% while Central Appalachian coal gained 0.7% and Powder River Basin coal fell 0.6%. Although the near-term commodity coal futures showed mixed trading, the coal stocks were on fire with Patriot coal up more than 33% (albeit it is a distressed situation), shares of Alpha Natural up 6.4%, and Peabody Energy share up 5.4% to name a few. The coal stock ETF (ticker: KOL) gained 3.7%.

Wednesday, July 4, 2012

Iranian Fireworks Sends Oil Skyward

The news that Iran shot missiles in a military practice exercise has sent oil rallying past near-term resistance on higher volumes.


If you have a good sense of how the geo-political scene will transpire, then you have may have a good trade one way or another. For most other investors, it would probably be advised to stay clear of oil. That said, if tensions with Iran remain tense for any considerable time, expect the rise in oil to continue, putting pressure on a weak global economy. 


Tuesday, July 3, 2012

Looking for 13% gain- Try ACI


We believe that coal stocks offer investors a unique long-term, value proposition at current prices. The shares in some coal companies have rallied nicely over the last week, and if you are looking for a trade, we suggest you look at the shares of Arch Coal, ticker ACI. (full disclosure: we own shares in ACI in our portfolios and intend to own it long-term) ACI has traded up 38% since the June 26 intra-day low and we think that the technical setup, price action, and volume characteristics suggest that the shares will trade to the swing point of in the range of $8.40 to $8.30, a 12% to 13.5% gain from current prices.


In the chart above, you will ACI's shares have broken through the downtrend line that was established in the beginning of February along with the 20-day exponential moving average. It is also testing the 50-day moving average on a time-weighted trading volume of about 29 million shares, as of this writing, or more than 2.2x the 30day average. The next swing point to the upside is the $8.40 to $8.30 level established on May 2 and May 9, both high volume days. This price level is where we think shares will meet resistance before reconciling the overbought condition on the stochastics.


Trading Edge for 7/3/12


The market will have shortened holiday session today and volume is likely to be light. Our portfolios were up marginally in trading on July 2, as the market firmed late in the day, as gold stocks increased marginally versus a down down in the precious metal, and on relative strength in coal. Coal stocks look to have caught some relative interest over the last week, and the news flow/trading look to be more constructive.

As for the market, the SPY closed somewhat higher despite being sold off most of the day following the disappointing ISM manufacturing report for June. As one would expect, volume was weak in 7/2 trading as we approach the Independence Day.


The SPY was trading lower most the day after the initial sell off following the ISM manufacturing report. This sell off marked the intra-day low and the market chugged higher for the remainder of the trading sessions, albeit on light volume.


The SPY traded somewhat higher on the day, but is still within the resistance range we talked about in previous posts. The RSI, MACD, and stochastic measures all show the market may be getting tired. The rally that started on June 25 will probably need either better news flows, higher volume, or an improved economic outlook to push it higher.


The commodity index (Dow Jones UBS Commodity Index) has caught a bid in the last few weeks and the price has increased over both the 20-day and 50-day exponential moving averages. The MACD is improving and has crossed over the 0 line, showing that this run may continue. However, the index looks overbought in the short-term.


The components have diverging price charts. Corn (used as an example of agriculture commodities, which have rallied in recent weeks on world-wide droughts... see here http://soberlook.com/2012/07/global-drought-is-damaging-crops-will.html), while the precious metal complex remains flat lined. Crude has garnered some interest from traders, but has run into resistance on volume lighter than in the downdraft, while natural gas looks to be testing the 200-day exponential moving average, as it attempts a durable rally.


Monday, July 2, 2012

Flash ISM- we were wrong

The June 2012 PMI declined by more than 3 points and fell below 50. Will have to go back and check the historical observances against the current PMI, but it appears the slowing global economy trumped the historical setup. The customer inventories index print of 48.5 is worrisome.

From the Institute of Supply Management
  • "Business is still strong, with some nagging question whether it will be sustained." (Machinery)
  • "The economy and general business seem to be getting better even though recent data say otherwise." (Fabricated Metal Products)
  • "Significant raw materials price correction underway." (Plastics & Rubber Products)
  • "Local labor market shows no signs of slowing down. Competition for technical services/skilled craft remains tight." (Petroleum & Coal Products)
  • "Overall demand signals from sales forecast are trending down in all regions." (Computer & Electronic Products)
  • "Although our shipments are up year over year and from prior month, we can feel some head winds, especially from Europe. We are watching our expenses very tightly and being cautious." (Apparel, Leather & Allied Products)
  • "Business continues to exceed forecast in all markets." (Primary Metals)
  • "Economy seems to be slowing slightly due to concerns in Europe; however, production has not changed a great deal." (Transportation Equipment)
  • "Business has started to show signs of slowing." (Furniture & Related Products)
  • "Slowing world economies, particularly China, are reducing 3Q and later orders and drastically dropping some raw material prices." (Chemical Products)

MANUFACTURING AT A GLANCE
JUNE 2012


Index
Series
Index
Jun
Series
Index
May
Percentage
Point
Change


Direction
Rate
of
Change

Trend*
(Months)
PMI 49.7 53.5 -3.8 Contracting From Growing 1
New Orders 47.8 60.1 -12.3 Contracting From Growing 1
Production 51.0 55.6 -4.6 Growing Slower 37
Employment 56.6 56.9 -0.3 Growing Slower 33
Supplier Deliveries 48.9 48.7 +0.2 Faster Slower 5
Inventories 44.0 46.0 -2.0 Contracting Faster 3
Customers' Inventories 48.5 43.5 +5.0 Too Low Slower 7
Prices 37.0 47.5 -10.5 Decreasing Faster 2
Backlog of Orders 44.5 47.0 -2.5 Contracting Faster 3
Exports 47.5 53.5 -6.0 Contracting From Growing 1
Imports 53.5 53.5 0.0 Growing Same 7
             
OVERALL ECONOMY Growing Slower 37
Manufacturing Sector Contracting From Growing 1

Sunday, July 1, 2012

The power of Customer Inventories or why the June manufacturing ISM may surprise to the upside.

According to figures at Marketwatch (http://www.marketwatch.com/Economy-Politics/Calendars/Economic), the Consensus is looking for a June 2012 Purchasing Managers' Index (PMI), as compiled by the Institute of Supply Management (ISM), of 51.5, a full two points lower than the May 2012 print. Although we do not specifically forecast any monthly PMI print, we also believe that the Consensus estimate may be overly pessimistic and that the June 2012 results may surprise to the upside.

What gives us this confidence is the current trend in of the new orders and customer inventories measures along with our analysis historically results. Although you may know and followed the new orders index, most have know very little of the customer inventories index. We believe the customer inventories index is the least followed and understand of the PMI measures, but that it is one of the most important.

The ISM defines the customer inventories index as "the level of inventories the organization's customers have". Like its counterpart measures, the customer inventories index is also a diffusion index, meaning it measures the level of change within a particular group. Unlike the other PMI measures however, the customers inventories index should be thought of counter intuitively. By this we mean that results below 50 are a positive and results above 50 are negative. In actuality, we do not see many customer inventories prints above 50 and results fall within a range around 45.6. This means that results above 45.6 are generally negative while prints below this threshold are positive. As a comparison, the PMI and other measures have a central tendency around 50.

We observe an interesting dynamic with the customer inventories index. It will, and this is intuitive if you think about it, move inversely with the new orders index- i.e. a rising (falling) new orders will correspond with a falling (rising) customer inventories index. More importantly, a low absolute or relative customer inventories index can point to positive PMI measures for at least six months out. For instance, we observbe that since January 1997, the date the ISM began measuring customer inventories, the PMI has never posted a print below 50 in any 6-month period following a customer inventories index tghat was came in at a measure of 42 or lower.

Of course, the latest customer inventory index of print (43.5) is not below the 42 threshold. However, we note that relatively low customer inventory idex measures can be used to guage what the directional change of the PMI in the month ahead period. Our relative analysis uses changes in the new order index over the preceeding 3-month period in regards to low levels in customer inventories. We observe that when the new orders index has increased over the last three months to a measure at or above 55 and the customer inventories index comes in at 43.5 or below, the next months PMI has exhibited a rather strong upward bias. We see that when this dynamic is present, the one month forward PMI rises an average of 0.65 points and shows an increase nearly 60% of all such occurences. This compares to a nearly flat one month change in all PMI measures since January 1997 and the PMI increasing 48% of the time in all monthly periods over the same time period. It is our belief that this occurs because the relatively low level in channel/customer inventory leads to further production and order growth. Thus providing a floor under overall business activity and the PMI.

So what does this mean for the June PMI? Provided that the global economy is slowing and that economic growth in the U.S. appears anemic, we can understand why the Consensus is looking for a sigficant decline in the June PMI. That said, our analysis of the historical PMI results leads us to conclude that the Consensus estimate may be overly pessimistic, with the new orders index climbing over the last three months to a level above 60 and the customer inventories index of 43.5. It is our belief that this dynamic in the May PMI report suggests that low levels in customer inventories will help support further growth in new orders and overll business activity. This leads us to conclude that the June PMI will surpise to upside.