Thursday, December 12, 2013

The 10 Laws of Bubbles- Kass

via thestreet.com with comments and thoughts in the parenthesis.

To my five conditions mentioned earlier, I add five more (several of these quantify the "degree of bubbliness" to complete my 10 laws of bubbles:
  1. Debt is cheap. (Yes)
  2. Debt is plentiful. (Yes, look up trends in covenant light debt)
  3. There is the egregious use of debt. (possibly, but definitely not as bad heading into 2007/08)
  4. A new marginal (and sizeable) buyer of an asset class appears. (Can you say the Fed or the investor class in housing)
  5. After a sustained advance in an asset class's price, the prior four factors lead to new-era thinking that cycles have been eradicated/eliminated and that a long boom in value lies ahead.(May be my own bias but I see a lot of talk of a weak economy countering discusses for continued strong or accelerating growth.)
  6. The distance of valuations from earnings is directly proportional to the degree of bubbliness. (S&P up 25% LTM versus17% gain in earnings.)
  7. The newer the valuation methodology in vogue the greater the degree of bubbliness. (still haven't seen any new valuation method floated by the Street. Although most ignore the skew in profit margins.)
  8. Bad valuation methodologies drive out good valuation methodologies. (see the above comment in 7)
  9. When everyone thinks central bankers, money managers, corporate managers, politicians or any other group are the smartest guys in the room, you are in a bubble. (a most definite yes. Isn't Bernanke the smartest man who has ever lived)
  10. Rapid growth of a new financial product that is not understood. (e.g., derivatives, what Warren Buffett termed "financial weapons of mass destruction"). (bitcoin maybe, but nothing mainstream in new financial products.)


Volume Off the High- Dec. 11 Trading Day Edition

I would not say there are any definitive shorts or sale candidates (or buy candidates for that matter) coming from yesterday's declining volume movers. To note though, the YINN ETF came off the highs as other China-related funds sold off ahead of the decline of equity prices in the US.  I am unsure if the heavy volume is more related the general decline in Chinese stock or influenced by the index change occurring today (Dec. 12), but I would air on the side of caution with this and assume the volume was more due to the index change.

However, RMT, a micro-cap ETF, declined hard along with other small-cap and risk-weighted names. Does this all mean we are seeing a shift in risk? More later.


High Volume High- Dec. 11 Trading Day Edition

A few noteworthy entries coming from yesterday's trading First, Ma moved to new highs after the company launched a $3.5 billion stock and a 10 for 1 stock split. Shares of competitor of V also moved higher,  but did not quite make the cut. Concerning the stock split though, the stock moving higher after a stock split reminds me of the euphoria in the late 90's

Second, GSL moved higher after the company announced a new note offering. Some were talking the company will initiate a dividend, but I have no opinion on that. However, the shipping industry (disclosure- I own a position in DSX) has caught a bid on the thought that the industry will improve on better supply and demand dynamics.


The Juno Fly By of Earth

In a word, stunning. 

The Juno spacecraft is set to rendezvous with Jupiter July 2016. In the meantime, NASA took the opportunity of the spacecraft's flyby of Earth, to gain a gravitational acceleration boost, to take some low-res, but still stunning video of Earth.

The flyby of Juno occurred on Oct. 9.


And An Increase in Supply- S&P Price/Volume Heat Map Dec. 11

The market took in on the chin in yesterday's trading, reflecting the warnings embedded in the previous push to new highs that lacked on juice. Although the the 110 basis point decline occurred on lower than average volume, we did see an expansion versus the move to the highs. This suggests to me that traders are in distribution mode.


This view is supported by what we saw in the yesterday's price/volume heat map. Sans staples, which by the way was the only sector seeing an increase in prices, supply ruled the day across the sectors. The increase in supply and lack of demand, in my mind suggests that the price decline does have some support. Although we will have to see if it have any traction, as a simple short-term trend analysis continues to suggest higher prices. With that said, I am watching move top side to gauge the volume characteristics. If we keep moving top side with decelerating volume, we are probably just seeing operators pairing positions before the decline.


Wednesday, December 11, 2013

All That Glitters Remains Risky

In the ended trading week, gold and gold equities remain in a higher risk, buy zone. Translation- only attempt to catch the falling knife at your own risk or use only long-term funds. In the latest week, money supply contracted versus the prior week, directionally in line with seasonal trends. However, the degree of the decline was greater than the seasonal average, the third week in four weeks this has occurred. The is starting to become a trend, and may indicate a slow down in economic activity or Fed actions. In any event, the timing models were little changed from previous week, but still improved from previous month.


6-Month model, currently -1.8 vs. -1.95 last week and -1.4 last month


1-Year model, -1.4 vs. -1.46 and -1.3


Long-term model, -1.7 vs. -1.9 and -1.3


Although the timing models continue to lean towards the positive, the risk model remains in a high risk mode. This suggests that further downside in the gold and gold equities could be in the offing and any buying should be done cautiously absent of an intra-week sign of strength. On this last point, we have seen some strength come into gold complex, or at the very least a lack of sellers at points sellers would have come into the market. However, I would stay cautious short-term. 


High Volume High- Dec. 10 Trading Day Edition

I will not delve too deeply into the names here, but there are a few noteworthy investments. First AZO, AZO moved to new highs after the company beat earnings by $0.01. This is in stark contrast with PBY, who not only reported lower than expected earnings but also garnered a spot on the latest 'volume off the high' list. Second, the title insurers are garnering interest by traders and investors, with both FNF and FAF trading up on volume in yesterday's trading.


Volume Off the High- Dec. 10 Trading Day Edition

Wanted to highlighted a couple of names that could see further downside after coming off of the highs in yesterday's trading. First, SBUX could close the gap at about $68 price point, some $8 lower than current prices. This was after the Street has apparently grown concerned about sales trend levels. However, I would do your homework with this one. Second, IEP, Icahn's investment vehicle, came off hard and continues to do so. This follows the announcement of a secondary share offering, essentially signalling an overvaluation in the portfolio. I would note there is a gap way down below $60 per share, or more than $50 lower than current prices.


Fireworks Between Now And Mid-January With Kitco's Hugg

Hugg is more bearish on the metals complex. He does provide a roadmap of what to watch in the near future.


Still More Selling But- S&P 500 Price/Volume Heat Map Dec. 10

Following the retest of the high, the S&P 500 has continued to pull backed, falling by about 30 basis points in yesterday's trading. This was as all sectors except for discretionary and materials names pulled back. 


The decline in the S&P 500 in recent trading sections appears to be more about a lack of buyers versus an influx of sellers. Although the price/volume heat map showed a few sectors with increased supply (actually utilities, healthcare and staples), the remainder of the sector groups showed benign supply/demand dynamics. The second day in which this set up has occurred. More so, the decline in equity prices yesterday came on light total volume. In all, I think the data characterizes the last few sessions as predominantly noise and that traders/investors are waiting for some piece of news to shake them from their comfort zones.


BCA's Bearish Gold Take

The below research piece is from BCA. Short-term, I think they are more correct than not, as I default to my timing model results which continue to point towards a high risk environment. That said, I remain bullish long-term on the thought that sound monetary and fiscal responsible actions are a pipe dream.

The window is closing for a gold (and silver) trading rally.
Stand Aside On Gold
Gold prices have failed to rally from deeply oversold conditions. Moreover, this does not simply reflect dollar movements. The advance/decline line for gold in various currencies also is falling.

Our Commodity strategists had been expecting countertrend rallies in gold and silver. Nevertheless, there are too many underlying negatives to offset the near-term boost from generous monetary conditions around the world. The equity risk premium is shrinking. The Fed is considering tapering bond purchases, likely in March or sooner. Inflation expectations are tame around the world. The “Iran tail risk premium” has fallen in the wake of a preliminary nuclear deal with the West.

Obviously, there are scenarios under which gold and silver will rally. For example, disinflation may be bad for gold, but deflation would be a game-changer. Outright deflation in the U.S. and other major countries would spur another burst of monetary experimentation and quash “taper talk”. Granted, there have been signs of weakness in U.S. mortgage applications and durable goods orders. However, we do not assign high odds to this scenario given the easing of fiscal restraint in the U.S. and Europe next year.

Bottom Line: Gold prices likely will “go nowhere” over the next few months, albeit with plenty of volatility as odds of Fed tapering shift.


QE Overstayed It's Welcome- Gartmen

We shall see how much the 'stimulus' has overstayed when they attempt to pull it back.


Tuesday, December 10, 2013

Volume Off The High- Dec. 9 Trading Day Edition

Not much going on in the volume off the high list from yesterday's trading day. First off, GNE has come under pressure after the company announced an acquisition of a competitor. Although RH is coming off recent highs despite the market waiting for the December 12 earnings announcement. Does someone know something here? I don't know. Supposedly a negative brokerage report sent the shares down. I would note that the a huge gap is left to filled some $8 lower than the current price.


High Volume High- Dec 9 Trading Day Edition

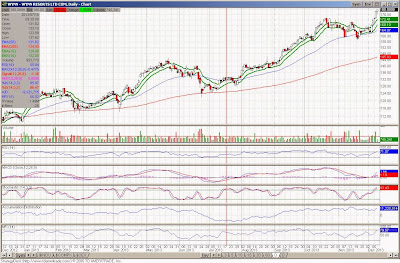
The most interesting from yesterday's new high volume highs is WYNN. Barron's weote up the stock positively on its website yesterday while JPM Morgan made the company one of its top picks. Looking at the chart, the price chart looks like a classic cup-and-handle breakout formation.


On Knowledge- Gilder

A somewhat long interview with George Gilder, but you cannot hope to gain knowledge in three minute clips....


A Dozen Things I’ve Learned from Jason Zweig

via 25iq

1. “The future value of every investment is a function of its present price. The higher the price you pay, the lower your return will be.” Value investors *price* assets based on their value *now* (based on data from the present) rather than make predictions about markets in the *future.*  Value investors put predictions about the future in the “too hard” pile.

2. “A stock is not just a ticker symbol or an electronic blip; it is an ownership interest in an actual business, with an underlying value that does not depend on its share price.” The best way to determine the intrinsic value a business is based on the price a *private* investor would pay for the entire business.

3. “You should do business with [Mr. Market]—but only to the extent that it serves your interests. Mr. Market’s job is to provide you with prices; your job is to decide whether it is to your advantage to act on them. You do not have to trade with him just because he constantly begs you to. By refusing to let Mr. Market be your master, you transform him into your servant…. “It’s harder than ever for long-term investors to ignore the trading madness of Mr. Market. But ignoring it remains the very essence of what it means to be an investor.” Markets are bi-polar and will *always* move up and down. These movements are not (1) rationally based, (2) based on market efficiency or (3) predictable with certainty. The best advice is simple: “be greedy when others are fearful and be fearful when others are greedy.” This is easy to say, but hard to do since it requires courage at the hardest possible time.  To outperform the market you must occasionally be a contrarian and be right on those occasions.

4. “Regression to the mean is the most powerful law in financial physics: Periods of above-average performance are inevitably followed by below-average returns, and bad times inevitably set the stage for surprisingly good performance.” That prices of investment assets will wiggle above and below intrinsic value is Mr. Market’s gift to you. Don’t try to predict when the wiggles will happen but rather be patiently waiting for when it happens. The “being patient” part of being a value investor is hard. If you expect the market to give you enough profit to buy a car or a speedboat next week, you will fall down. ” Value investors price stocks” rather than “time markets.”

5. “Investors have never liked uncertainty–and yet it is the most fundamental and enduring condition of the investing world.” An investor faces these situations: 1) possible future state known, probability known (risk), (2) Possible future state known, probability unknown (uncertainty) and (3) future state unknown, probability not computable (ignorance). How an investor deals with risk, uncertainty and ignorance will determine their level of success.

6. “The intelligent investor realizes that stocks become more risky, not less, as their prices rise, and less risky, not more, as their prices fall.” Risk is *not* equal to volatility as some people claim. There are many money managers who want you to believe/convince you that volatility is equal to risk because volatility is a major risk for them since if stocks drop in price investors will flee the money manager. These managers also love equating risk with volatility since it gives investors the impression that risk can be precisely quantified which justifies their fees. Since some probabilities are unknown and some future states are unknown, “risk” is not computable number.  It is ”volatility” after all which enables an investor to benefit from Mr. Market’s bi-polar behavior (i.e., volatility is actually the source of a value investor’s opportunity). For the best essay on the proper definition of risk read Warren Buffett’s 1993 Berkshire Shareholder’s letter.

7. “Approximately 99% of the time, the single most important thing investors should do is absolutely nothing.” As an investor you should bet seldom and only when the odds of success are substantially in your favor. The temptation of investors is too often toward action when inaction is their friend.  Keeping fees and expenses very low is important and avoiding hyperactivity helps with that objective.

8. “Investing isn’t about beating others at their game. It’s about controlling yourself at your own game.” Overcoming dysfunctional psychological heuristics is a trained response. That trained response requires work and discipline - if you want to avoid that, buy an index fund.

9. “Keep better records of your decisions.” By writing down your decisions and measuring their outcomes you are confronted with the fact that you are often a muppet. Hindsight bias, denial, overconfidence and other psychological biases are powerful. The easiest person to fool is yourself. I have a friend who thought he was a great investor until he wrote down his investing results for three years.  Now he is an index fund zealot.

10. “The way I like to think of day trading is that it’s probably the most effective weapon ever to commit financial suicide, … It’s an absolutely lethal way for the typical person to invest because it’s not even really a form of investing, it’s gambling pure and simple.” People love to gamble as anyone driving by a casino can see. In far too many cases this gambling finds its way into a person’s investing behavior. The difference between making a bet when the odds are substantially in your favor and when “the house” has an advantage is night and day.

11. “Most people will buy more when something goes up and either sell it or freeze when it goes down. The brain is really built as a pattern-recognition machine and a performance-chasing mechanism, and when you combine automatically perceiving patterns where they don’t actually exist with pursuing performance right before it disappears, you have a recipe for disaster.” Training yourself not to “chase performance” is essential.

12. “Most financial journalism, like most of Wall Street itself, is dedicated to a basic principle of marketing: When the ducks quack, feed ‘em…. Every columnist knows that if you ever write something that didn’t make anybody angry, you blew it.”


Advance/Decline Line Flashes a Warning

In my daily update of the price/volume heat map, I alluded to the advance/decline line on the NYSE. More specifically, the cumulative total of the advance/decline line, which show you below.


Just look at the trend of the advance/decline appears for the last year and then compare that to the trend in the S&P 500 over the same time period.


As the S&P 500 chugged higher, the advance/decline line has been trending sideways. This should suggest to you that the depth of the gains in the equity markets has been falling off and the breadth has been weakening. Definitely a developing situation.

Of Things To Come- S&P 500 Price/Volume Heat Map Dec. 9

Although the market gained in yesterday's trading, with a 20 basis point increase in value, the overall setup does not look constructive. You should not take this statement as if it is a short call or some sort of imminent warning. I am not that smart to call the exact top. However, we are definitely seeing signs of weakness here as equity prices have hit the late November highs.


For one, total volume levels on the uptrend that began December 6 have been generally weak and have tapered off as equity prices gained. Additionally, the cumulative advance/decline line, in my mind, does not support strong depth in equity price gains. More so, just look at the demand trends in the price/volume heat map below. Although overall prices gained, there just does not appear to be any support for this prices, as demand was relatively weak across the board. The trading just does not scream a strong follow through following the Friday's rally and may be an indication of things to come. It goes without saying that you should watch where the volume comes in to the market.


Bitcoin Battle- Keiser Report

Max highlights a number of intriguing aspects of the Bitcoin, be it as a monetary tool or investment vehicle.


Monday, December 9, 2013

The Shale Boom Is A Mirage More Than A Miracle

I have thought this for years, having studied the industry and understanding the dynamics of the drilling process. Not that those dynamics should get in the way of a good story.


Mixed Economic Signals- The Trouble With Employment

I have been alluding to the latest employment report still pointing towards a weak economic environment. Here I show you the results. Although the number of jobs openings, according to the establishment data, continues to gain, the second derivative household employment numbers continues to skew highly negative. The following chart shows you the trend in the year-over-year GDP versus the acceleration and deceleration trend in total employment.


What should be apparent is that an accelerated decline in total household employment corresponds with a weak economic environment. More so, there has been very periods since the late 1940's when the employment gains, year-over-year, were negative, and GDP growth was sub 2% and decelerating that future economic growth had turned negative. Will time be any different? We shall see.


Buying or Owning Stocks Is Now Dangerous: Stockman

Stockman seems to be a (legitimate) voice of reason amongst the crowd.


Mixed Economic Signals- The Trouble With Dividends

Despite the rosy outlook by economists and the Street, I think if you looked at little deeper than just the headlines you would see an economy that was just putting along. Although economic growth probably remains positive, that positioning looks precarious and all it could take to move into a retrenchment is some external event. For instance, a Fed tapering.

For instance, one measure I look at is the rolling three month summation of the number of S&P 1500 companies cutting dividends. The theory behind this is that companies will only cut dividends for one reason, pressure on their current business conditions and an outlook for these conditions to persist. A rolling three month summation is used to smooth out the quarterly fluctuations in the data. The following is the latest run of companies cutting dividends through the end of November.


The economy appears to be under stress whenever the count of companies cutting dividends is 50 or greater, This is clearly evident in the previous two recessions. Currently the count of the companies cutting dividends remains above 50 and continues to suggest an economy under stress if not full recessionary conditions.