Gold is going lower, at least, that is what I think the chart is telling us. First, take a look at the chart for gold over the last two years, as provided by stockcharts.com. As of Friday's close, gold prices are trading up into the $1,785 price level, and has been tracking upward slowly following the breakout above the $1,750 per ounce. However, this rise is not being confirmed technically. The RSI is above 80 and the peaks have been declining as the price has risen. The MACD has also been in a downtrend while the stochastic, which is in overbought territory, is also showing lower peaks versus the price. This can be seen in the 2-year chart of gold below.

More importantly, the price of gold is running into high-volume resistance levels established in or around March 2012 and August/September 2011. This challenge is not only occurring on declining volume levels, suggesting that the operators are plumbing for higher prices, but that the demand is waning as the price reaches into supply/resistance levels. This is not a constructive setup and suggests lower prices.

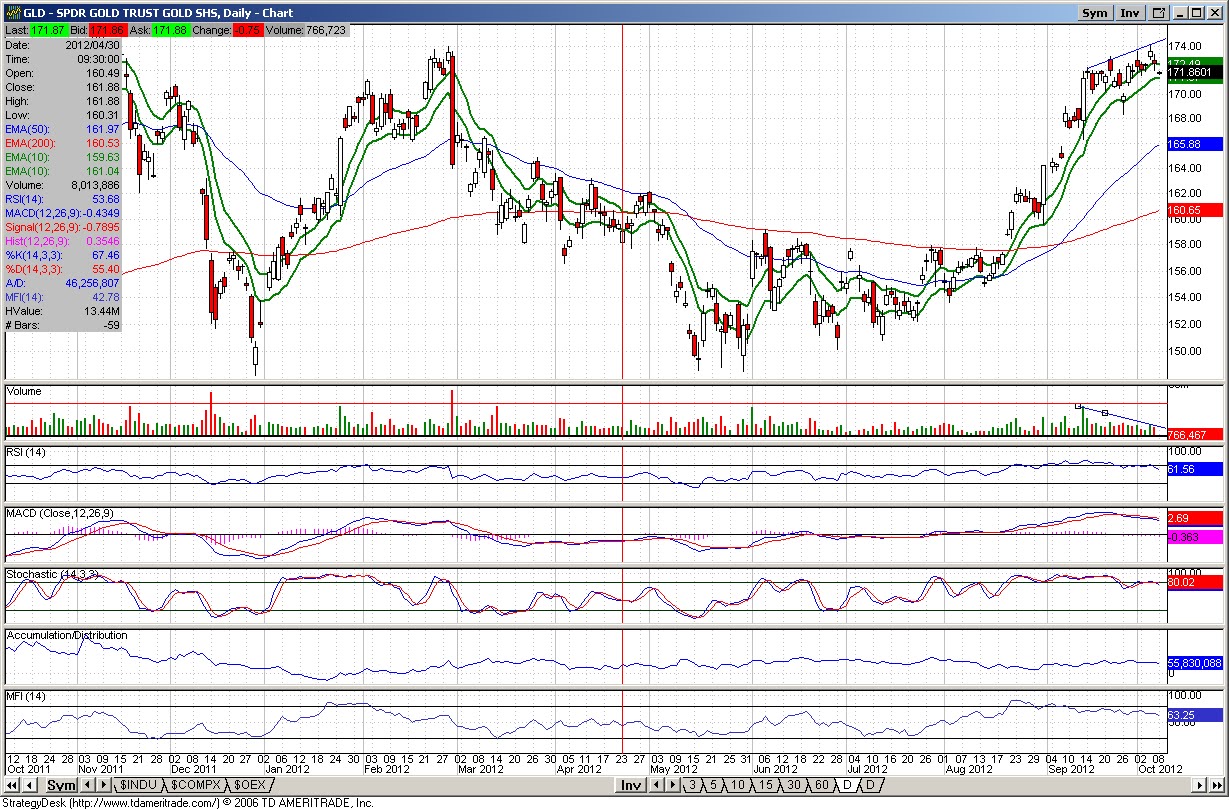
The same pattern is also seen on the GLD or the Spider Gold Trust. Although the patterns are the same, I think the price trend on the GLD is more illuminating in that there is a $4 to $5 gap open on September 6. Ultimately, I think this setup suggests that gold prices will correct roughly 5% from current price and will move into the $164 range on the GLD, closing the September 6 gap. As such, I am taking a short GLD position in the short trading portfolio. That said, this is a trading call and provided no significant change in the other inputs of the precarious metal timing model (detailed in the All that Glitters weekly piece) will likely get more constructive on gold/precious metal sharers as gold prices decline.

More importantly, the price of gold is running into high-volume resistance levels established in or around March 2012 and August/September 2011. This challenge is not only occurring on declining volume levels, suggesting that the operators are plumbing for higher prices, but that the demand is waning as the price reaches into supply/resistance levels. This is not a constructive setup and suggests lower prices.
The same pattern is also seen on the GLD or the Spider Gold Trust. Although the patterns are the same, I think the price trend on the GLD is more illuminating in that there is a $4 to $5 gap open on September 6. Ultimately, I think this setup suggests that gold prices will correct roughly 5% from current price and will move into the $164 range on the GLD, closing the September 6 gap. As such, I am taking a short GLD position in the short trading portfolio. That said, this is a trading call and provided no significant change in the other inputs of the precarious metal timing model (detailed in the All that Glitters weekly piece) will likely get more constructive on gold/precious metal sharers as gold prices decline.
No comments:
Post a Comment