Monday, September 30, 2013
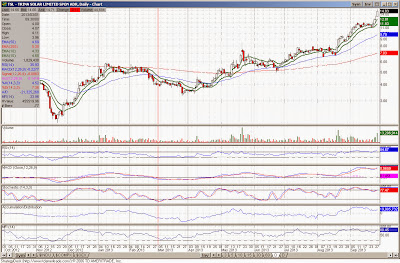
High Volume High- 9/27 Trading Day Edition
Still strange that we are seeing a considerable number of names vaulting to new highs with volume support, which flies in the face of the overall weak demand dynamics we see in the price/volume heat map and the overall value change in the indexes. This also compares to very few volume off the high names.
Will This Ever Stop- S&P 500 Price/Volume Heat Map- 9/27 Trading Day and Week Edition
Yet again, the S&P 500 logs in another day of falling demand. Lower demand in last Friday's trading led to an across board decline across the ten sectors, most acutely felt in materials, and an overall decline in value of about 40 basis points. The outstanding performance on the day, if one can call it that, came from the discretionary and healthcare groups, both of which ended the trading day flat.
Without even looking you could probably guess what the price/volume heat map looks like. We saw a heavy weighting towards the supply side of the spectrum, a continuation of what has occurred for many trading days now. I continue to expect but not necessarily forecast some sort of snap back at some point soon. We just don't see such one-sided moves continue without some sort of reversion to the mean or counter trend move. Additionally, total volume levels to the downside here have been weaker than average and are decelerating. I would not rule out a sharp reversal once the US Congress continues spending beyond their (our) means.
For the week ending 9/27
It should also be of no surprise that for the week, the S&P 500 closed down on weak demand trends.
For the week ending 9/27
It should also be of no surprise that for the week, the S&P 500 closed down on weak demand trends.
Sunday, September 29, 2013
All That Glitters- Precious Metal Stock Remain Attractive
I have been bad, and have not (at least not publicly) generated or discussed my gold and precious metal stock timing models on a regular weekly basis. The fact is, we are not really seeing much going on in the models....... or gold stocks for that matter. Yes, I know there have been plenty of +/- 10% moves in the gold and precious stocks depending on your initial reference point. Looking at multi-month period however, gold and the gold stock indexes have largely traded within a fairly large range since May or June of this year. I guess if you are a better trader than I am, you could take advantage of this volatility- hell at the very least use some straggle or strangle strategies in your trading to capture the volatility bet. But I am not one to play that game and as for options, I have some restrictions on what I can do there. I would much rather pick longer-term entry and exit points.
This is what I think we are seeing in the precious metal complex, a long-term entry point. As long as central banks continue to print, the long-term viability of fiat currencies will be called into question. Questioning the validity of currency leads one to gold. I would much prefer to accumulate the metal and gold stocks at this juncture than try to play the volatility for a quick few bucks one way or another.
In any event, the following presents the latest timing model results with the present calculation as compared to the month ago calculation.
6-Month, -0.4 vs. -0.3
1-year, -1.1 vs. -1
2-year, -1.7 vs. -1.6
Risk measure, Positive
All three timing models remain below the 0 demarcation, indicating a higher likelihood of better-than-average forward returns. Additionally, the risk measure remains positive. Positive risk measurements in the past have 'helped' improve the overall performance metrics of the simple model results, essentially by avoiding the falling knives.
Blackberry: Lessons from the Smartphone Wars- The Mises View
Albeit great commentary, the one aspect that the Mises Institute and Peter Klein misses is that Blackberry is a great example of what happens to a company under attack from disruptive innovators. For Blackberry, the disruptors were the smartphone developers focusing on the retail consumer. This was a segment mainly ignored by Blackberry, who at the time owned the corporate market, primarily due to the company's early entry into the market and the security software in the Blackberry ecosystem. Essentially, Blackberry ceded the lower end of the market to new entrants, entrants that continual moved up market. When the entrants like Apple, Samsung, and others moved into corporate market, Blackberry was finished.
The Debt Ceiling- Raised to Avoid Paying the Bills.
I don't know anyone who buys the rhetoric. Raising the debt ceiling adds to the debt, and increasing your debt is not paying your bills.
Subscribe to:
Posts (Atom)


