As a
follow up to my post about the lunacy in the Fed's equity risk premium/the market is undervalued analysis, John Hussman of Hussman Funds says it best in his weekly column...
The
total capitalization of the U.S. stock market is presently about $17
trillion (about $16.2 trillion as non-financials). The Federal Reserve
is purchasing $85 billion of Treasury and mortgage-backed bonds each
month. This creates a pool of bank reserves that have to be held by someone at
each point in time, until those reserves are retired. This
zero-interest cash is a hot potato that certainly creates speculative
demand. But it is thesuperstitious aspect
of the belief in QE – as if it has some inexplicable power to remove
downside risk – that deserves just as much credit for the recent
advance. It is the superstition that QE mysteriously removes economic risk, and the psychological discomfort of
low interest rates far beyond its true effect on investment value, that
has encouraged investors to abandon their demand for a risk premium to
adequately compensate them for the risk they are taking.
How
can we know that? Simple. We can demonstrate that QE is not exerting
the bulk of its effects through cash flows or the effect of lower
interest rates on earnings or present discounted value. This leaves the
suppression ofrisk premiums as the remaining and primary effect of QE. In other words, QE has not increased the value of equities. It has only increased the price, but that increase in price has no significant fundamental underpinning.
To
see this, first consider cash flows. Imagine that instead of attempting
to boost stock prices indirectly through quantitative easing, the Fed
took the candy-land approach of literally handing the $85 billion directly to
stockholders to reward them for owning stocks. How much would that
direct cash distribution benefit a stock market with a $17 trillion
market capitalization? Do the arithmetic. Only 0.5% a month. Yet
investors have chased prices at a far more rapid pace as a result of
quantitative easing. Remember, of course, that the Fed is not in fact
distributing cash to shareholders.
What
about the benefit of lower interest rates? Domestic nonfinancial
corporate debt is presently $8.6 trillion. Even a 4% reduction in
interest rates (400 basis points) comes to $344 billion a year. Assume
that benefit accrues strictly to publicly traded companies, and extend
that benefit over 5 years. It’s still only worth 10% of market
capitalization. As a side note, lower interest rates also suppress
income from corporate investments, particularly with large amounts of
cash on corporate balance sheets. And though it has become a fad to
subtract out cash from market capitalization, it is a profoundly
incorrect fad. If it was correct, a company with a billion dollars of
market cap could issue a billion dollars of debt, hold the proceeds in
cash, and the stock could be considered "free."
What
about higher GDP leading to greater profits and supporting stocks that
way? Take the current ratio of corporate profits/GDP of 11% at face
value (even though that share is 70% above the historical norm), and
let’s even assume that all of these profits go to corporations with
publicly traded stocks. How much would GDP have to rise, sustained over 5
years, to justify even a 10% increase in market capitalization? The
required amount of additional GDP is 1.7 trillion / 0.11, or $15.5
trillion, or about $3.1 trillion a year sustained over 5 years. The
present size of the U.S. economy is about $16 trillion. So yes, if QE
could boost the size of the U.S. economy by about 20% and sustain it
over 5 years, and the additional earnings could be delivered entirely to
stock market investors in cash, it would justify a 10% increase in
market capitalization.
Here’s
one for geeks: What about the effect of a lower capitalization rate on
discounted future cash flows? Simple. Take a given initial cash
distribution and assume 6% annual growth, which is about the long-term
peak-to-peak growth rate of earnings and nominal GDP over the economic
cycle. Discount those cash flows annually into the indefinite future.
Now drop the discount rate by about 4% (400 basis points) for 5 years.
Even 10 years. Try 15. How much does the present discounted value
increase? Not much – about 5-15% depending on your initial discount rate
and how long you sustain the change.
We’ve
certainly seen people correlate the monetary base with the S&P 500
since 2009, ignoring that two rising lines will always have a
correlation of over 90%, and inferring targets for the S&P based on
assumptions about base money. But this is little more than extrapolation
based on statistical misuse. It may very well be that the promise of
more QE will produce a reflexive pursuit of stocks in the same
direction, but investors should at least be aware that this pursuit has
no fundamental basis, and rests purely on the willingness of investors
to abandon any need to be compensated for risk.
What
concerns me most here is the lack of effort that investors are taking
to analyze and quantify the mechanism by which quantitative easing
should work, beyond a vague superstition that “it just does.” The notes I
receive suggesting that somehow QE makes all historical economic
relationships, profit margin dynamics, and financial relationships
irrelevant remind me of some remarks that appeared in Business Week:
“During
every preceding period of stock speculation and subsequent collapse
there has been the same widespread idea that in some miraculous way,
endlessly elaborated but never actually defined, the fundamental
conditions and requirements of progress and prosperity have been
changed, that old economic principles have been abrogated, that all
economic problems have been solved, that industry has suddenly become
more efficient than it ever was before … that business profits are
destined to grow faster and without limit, and that the expansion of
credit can have no end.”
Those remarks unfortunately waited to appear until November 1929.
In short, there is no transmission mechanism by which QE has any large and beneficial effect on the value of equities. There has certainly been an effect on price – but this effect is driven by the
willingness of investors to abandon their demand for a risk premium
that will actually compensate them for the risk they are taking.
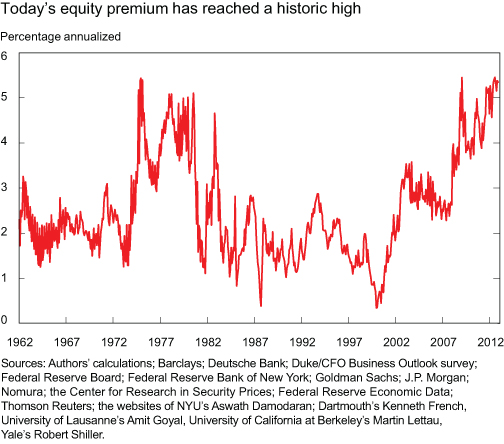
Sounds more like the equity risk premium is a lot lower than 5% to 6%.