This chart 'analysis" just won't appear to die. Not only did Barry Ritholtz of The Big Picture mention it last week (reiterated today), so did David Tepper of Appaloosa on CNBC this morning. The char in question....
And here is a brief explanation....
Outside of this analysis smacking me as a modified Fed Model valuation, which has been shown to be ineffective, an even more simple critique is that the FED IS HOLDING DOWN INTEREST RATES. The present period just does not have any modern historical precedence. The comparison of the current equity risk premium against the equity risk premium of the period between 1972 and the early 1980's is just bunk.
The 10-year treasury rate- which is not the best proxy of the risk-free rate but it is not the worst either- traded in a range of 7.5% to more than 15% between the mid-1970's and the early 1980's. This compares to a manipulated 10-year treasury rate of just 1.76% currently. Just do the math, the relative comparisons are not even close.
More importantly, the Fed's QE has had the affect of suppressing interest rates. I am not willing to wage any educated guess as to what degree interest rates are being held down, but the trading rage in treasuries prior to the Fed embarking on monetary easing to infinity was 2.5% to 5%. Much higher than current rates. More so, CPI inflation has been tracking in or around the 2% rate for the last few months. Adding to that a rate component for risk, growth, liquidity, etc. can bring you to an estimated risk free rate well over 2%, but probably even higher depending on your exact estimates. Whatever the estimates, the risk free rate is unlikely to be lower than 2%. Optimistically, if you adjust the risk-free for the Fed's manipulation, the actual equity risk premium is probably more like 3%. Pessimistically, there is probably no equity risk premium.
One last note on this topic, just think where this original analysis is coming from..... The Federal Reserve Bank of New York. No matter how faulty the logic, Bernanke et. al. have nearly outright stated they are targeting higher equity prices. In essence, this research from the Fed is just an attempt to sell us the benefits of the infinite money printing program.
And here is a brief explanation....
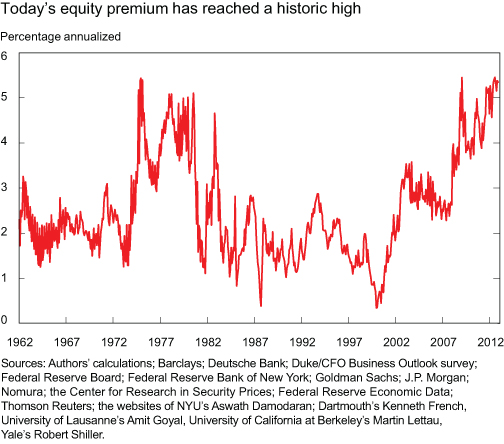
The equity risk premium is the expected future return of stocks minus the risk-free rate over some investment horizon. Because we don’t directly observe market expectations of future returns, we need a way to figure them out indirectly.
That’s where the models come in. In this post, we analyze twenty-nine of the most popular and widely used models to compute the equity risk premium over the last fifty years. They include surveys, dividend-discount models, cross-sectional regressions, and time-series regressions, which together use more than thirty different variables as predictors, ranging from price-dividend ratios to inflation. Our calculations rely on real-time information to avoid any look-ahead bias. So, to compute the equity risk premium in, say, January 1970, we only use data that was available in December 1969.while more can be found here NY Fed’s Liberty Street Economics.
Outside of this analysis smacking me as a modified Fed Model valuation, which has been shown to be ineffective, an even more simple critique is that the FED IS HOLDING DOWN INTEREST RATES. The present period just does not have any modern historical precedence. The comparison of the current equity risk premium against the equity risk premium of the period between 1972 and the early 1980's is just bunk.
The 10-year treasury rate- which is not the best proxy of the risk-free rate but it is not the worst either- traded in a range of 7.5% to more than 15% between the mid-1970's and the early 1980's. This compares to a manipulated 10-year treasury rate of just 1.76% currently. Just do the math, the relative comparisons are not even close.
More importantly, the Fed's QE has had the affect of suppressing interest rates. I am not willing to wage any educated guess as to what degree interest rates are being held down, but the trading rage in treasuries prior to the Fed embarking on monetary easing to infinity was 2.5% to 5%. Much higher than current rates. More so, CPI inflation has been tracking in or around the 2% rate for the last few months. Adding to that a rate component for risk, growth, liquidity, etc. can bring you to an estimated risk free rate well over 2%, but probably even higher depending on your exact estimates. Whatever the estimates, the risk free rate is unlikely to be lower than 2%. Optimistically, if you adjust the risk-free for the Fed's manipulation, the actual equity risk premium is probably more like 3%. Pessimistically, there is probably no equity risk premium.
One last note on this topic, just think where this original analysis is coming from..... The Federal Reserve Bank of New York. No matter how faulty the logic, Bernanke et. al. have nearly outright stated they are targeting higher equity prices. In essence, this research from the Fed is just an attempt to sell us the benefits of the infinite money printing program.
No comments:
Post a Comment