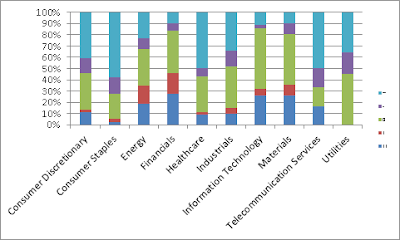
Still no sign of demand in the equity markets. I suppose investors are turning their attention and (investable funds) to the bond markets, as the long-bond rates have fallen, on their way to what looks like the 200-day moving average. As usual, I provide the breakdown of the daily sector performance below, which at first glance seems mixed.

I would not be surprised if we do not see some snap back rally in the short-term here. We have seen five trading days of lower demand dynamics on overall decelerating volume levels. Provided this setup and considering that equity prices broke to new highs last Wednesday (considering the notion that a break to new highs suggests further new highs), I would not be surprised at all to see a volatile regressive action to upside here shortly. Looking at yesterday's price/volume heat map, the supply/demand dynamics look more choppy versus the last few trading days. Does this suggest a changing trend? We shall see,


I would not be surprised if we do not see some snap back rally in the short-term here. We have seen five trading days of lower demand dynamics on overall decelerating volume levels. Provided this setup and considering that equity prices broke to new highs last Wednesday (considering the notion that a break to new highs suggests further new highs), I would not be surprised at all to see a volatile regressive action to upside here shortly. Looking at yesterday's price/volume heat map, the supply/demand dynamics look more choppy versus the last few trading days. Does this suggest a changing trend? We shall see,


No comments:
Post a Comment