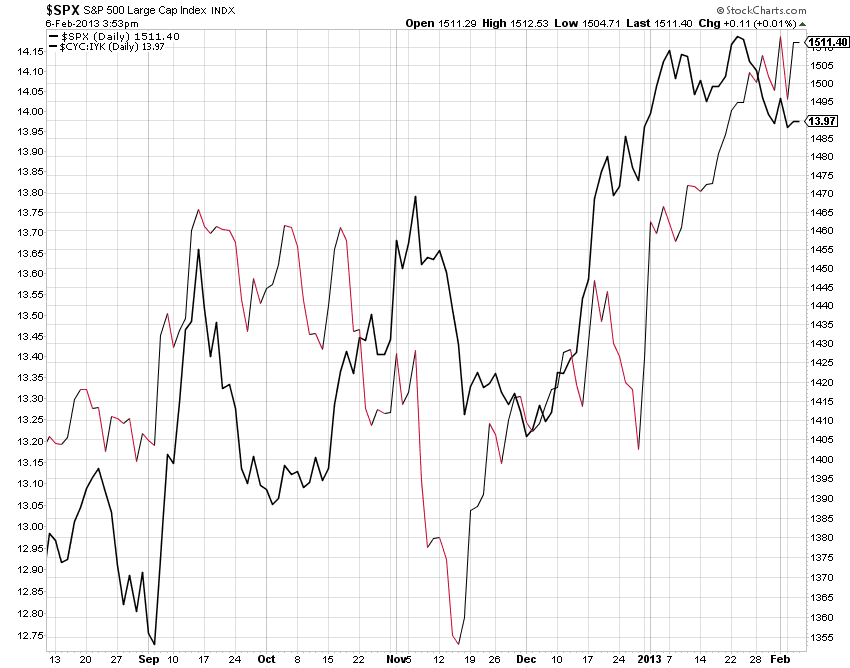
I have not provided an update on this chart in quite a while. The chart shows the price of the S&P 500 versus the relative price of the Morgan Stanley Cyclical Index (ticker CYC) to the IShares Down Jones US Consumer Goods (ticker IYK, and tracks a group of non-cyclical company stocks). The theory behind this relative price comparison is that when cyclical stocks are outperforming non-cyclical stocks, the risk appetite for investors is likely rising. As the risk appetite is rising, so should the equity markets and other risk assets.

The relationship is no one-for-one, but can be illustrative in conjunction with other measures, such as the relative price of junk bonds to investment grade corporate bonds. Notice the recent divergence in the CYC/IYK relative price and the S&P 500. This corroborates the divergence in the JNK/LQD relative price. I do not think this means that the market is about to immanently tank, but it is a bit of evidence suggesting that investors are becoming concerning about growth and may be reducing their risk exposure.
The relationship is no one-for-one, but can be illustrative in conjunction with other measures, such as the relative price of junk bonds to investment grade corporate bonds. Notice the recent divergence in the CYC/IYK relative price and the S&P 500. This corroborates the divergence in the JNK/LQD relative price. I do not think this means that the market is about to immanently tank, but it is a bit of evidence suggesting that investors are becoming concerning about growth and may be reducing their risk exposure.
No comments:
Post a Comment