Wednesday, October 16, 2013
Technical Take On all That Glitters
Just a quick post here. As I mentioned here, gold and gold equities appear to be setting up for a long-term turn. Please don't take this call as suggesting that the ultimate bottom is in are that prices will rise to infinite from here because I am not. That said, I think we are seeing signs the selling pressure is abating in conjunction with downside momentum that has slowed. For a longer-term perspective, lets look at the weekly charts for the GDX and the GLD.
Marketvectors Gold Miner ETF- GDX

Gold SPDR ETF- GLD

First, you should notice that both charts look similar so I will discuss the similar characteristics. After announcing the continuation of QE to infinity, gold and gold related investments popped. I thought and continue to think that this was a sign of a trend change. Alas, the turn in all that glitters appears to be more complex and precious metal related investments have moved back toward the yearly lows. That said, the decline has come on falling volume levels, suggesting that potential sellers are... less motivated. Technically speaking, the selling pressure also appears to be abating. The MACD continues to improve from the June/July lows. More so, the trend in the RSI has diverged from the price trend, as the RSI posts higher lows. All together, I think could suggest a long-term turn in the precious metal related investments is at hand.
The Biggest Scam In The History Of Mankind- The Hidden Secrets of Money Part 4
I got to say I really hate the tone producers try to set with dramatic music.That said, get through the dramatic BS and you have an informative lesson here.
Gold Shares and All That Glitters Continue to Become More Attractive
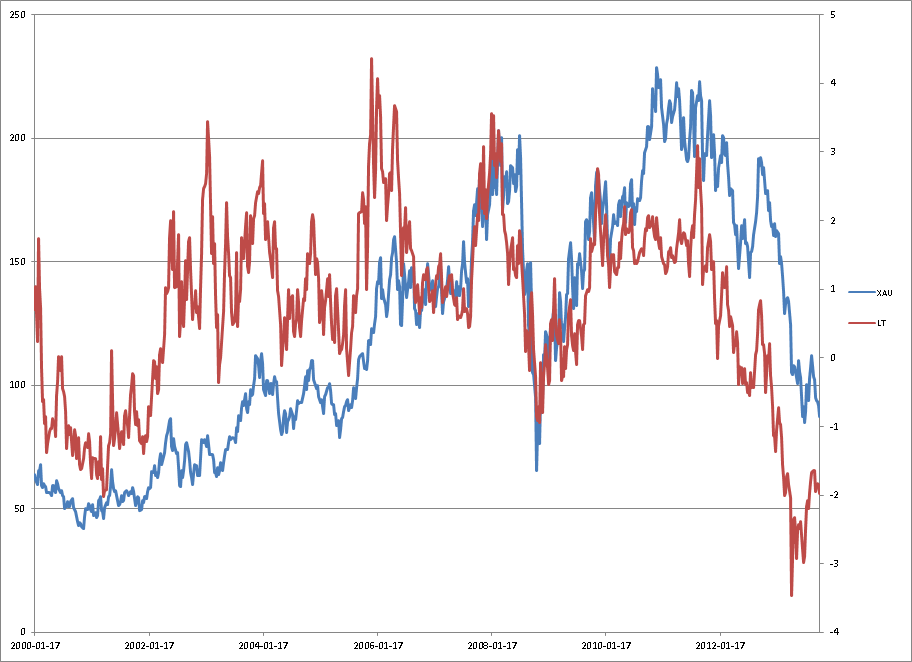
All that glitters has become more attractive in my opinion. This is as the price of gold has declined in recent weeks, on a number of items including that a resolution of the debt ceiling would lead more certainty and an improved economy, a thesis that has entered the lexicon of the Street despite what I have shown as no relationship between economic growth and gold. More so, there does appear to be a weaker relationship between the price of gold and increasing government debt, suggesting that a raising in the debt ceiling is gold positive. That said, the Street's bear thesis is what it is. Although the thesis more than likely leaves many holders of gold, like myself, questioning past trading decisions, at the very least the recent decline in gold and gold-related investments provides further opportunity to increase exposures.
With that, on to the timing models. Although money supply growth continues to decelerate year-on-year, M2 has experienced an acceleration of sorts in the past few weeks, due in part to seasonal trends. The upward moves in the supply of money has coincided with downward lurches in both the the yellow metal and the related long-centric investments. All in, the models have marked an improvement over the last week and month. I show the latest results below.
6-Month Model, present rating -1.35 versus -0.89 last week and -0.84 last month.

1-Year Model, -1.39, vs. -1.23 and -1.3

2-Year Model, -2 vs. -1.84 and -1.95

Risk Model, Remains positive but is falling.

Although I think you and I should keep a watch on the risks at this juncture, noting that the risk measure has fallen back towards the zero demarcation, I still think that gold equities remain attractive. For one, the technicals here look may be pointing towards to a long-term turn. Additionally, the risk measure remains positive while the timing models remain in a buy target zone. This is as money continues to printed into existence by the Fed and the government is set once again to borrow more money.
With that, on to the timing models. Although money supply growth continues to decelerate year-on-year, M2 has experienced an acceleration of sorts in the past few weeks, due in part to seasonal trends. The upward moves in the supply of money has coincided with downward lurches in both the the yellow metal and the related long-centric investments. All in, the models have marked an improvement over the last week and month. I show the latest results below.
6-Month Model, present rating -1.35 versus -0.89 last week and -0.84 last month.

1-Year Model, -1.39, vs. -1.23 and -1.3

2-Year Model, -2 vs. -1.84 and -1.95
Risk Model, Remains positive but is falling.

Although I think you and I should keep a watch on the risks at this juncture, noting that the risk measure has fallen back towards the zero demarcation, I still think that gold equities remain attractive. For one, the technicals here look may be pointing towards to a long-term turn. Additionally, the risk measure remains positive while the timing models remain in a buy target zone. This is as money continues to printed into existence by the Fed and the government is set once again to borrow more money.
Gold, Government Debt, and the Last Time the Debt Ceiling Was Raised
Posted earlier at Zerohedge. Lends itself to the thesis that government debt and gold prices are linked. We will have to watch if the something similar plays out this time. More on this soon.
U.S. lawmakers are scrambling to come up with an agreement to increase the federal debt ceiling before tomorrow’s deadline. Gold has not priced in a U.S. default - which could result from failure to raise the borrowing limit - on expectations that Congress will reach a deal at the last minute.
A default remains unlikely but should it happen it would roil global markets, hamper economic recovery and lead to another wave of safe haven gold buying.
More likely, is that politicians once again raise the debt limit to over $17 trillion - thereby eliminating the short term crisis but increasing the likelihood of a far bigger crisis in the coming months and years.
Physical buying remains robust particularly in China and India where premiums are rising again as gold is snapped up by canny Asian value buyers.
Gold premiums in India, the world's biggest buyer of gold along with China, hit a record $100 an ounce due to a shortage of bullion to meet festival demand. In China, premiums in the Shanghai Gold Exchange climbed to over $20 an ounce from about $7 two weeks ago.
Gold has fallen about 4% since the government shutdown began on October 1, leading many to believe that if there is no debt deal, the price could shoot up, particularly should we get a significant bout of “risk off” in markets.
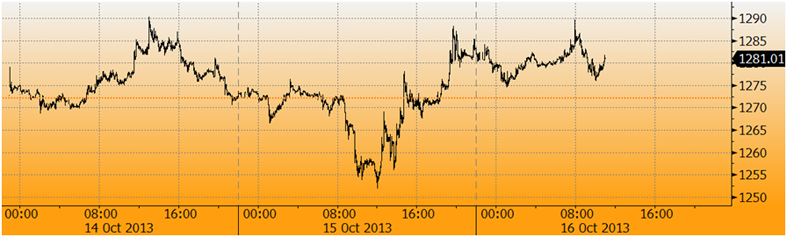
Gold In USD, 3 Days - (Bloomberg)
It is interesting to note that in 2011, gold rose in the months prior to the debt ceiling agreement. Then in the immediate aftermath of the debt ceiling extension agreement on August 2nd 2011, gold surged another 17% in 15 trading days after the agreement was reached. From August 1st to August 22nd, gold rose from $1,619/oz to over $1,900/oz.
The United States lost its important AAA credit rating from Standard & Poor's late on Friday August 5th, 2011, in a dramatic vote of no confidence for the world's largest economy and the U.S. dollar.
This was a catalyst for the surge to the record nominal high of $1,920/oz two weeks later.

Gold In USD, 10 Days - (Bloomberg)
How Fitch has not downgraded the U.S. already is a mystery to analysts looking at the U.S. fiscal position and the lack of political will to tackle it. It seems likely that significant political pressure is being put on credit ratings agencies regarding their credit rating of the U.S.
The very poor fiscal position of the U.S. will gradually erode confidence in the dollar which will see it continue to lose value against gold. The continuing depreciation of the dollar and the further downgrading of the U.S. credit rating from AAA will contribute to higher prices again.
The question is when, rather than if.
GoldCore’s 10th Anniversary Gold Sovereign & Storage Offer
Click For Details: Gold Sovereigns @ 5% Premium Over Spot (normally 8.5%-15% premium) & 1st Year's Storage @ Half Price
U.S. lawmakers are scrambling to come up with an agreement to increase the federal debt ceiling before tomorrow’s deadline. Gold has not priced in a U.S. default - which could result from failure to raise the borrowing limit - on expectations that Congress will reach a deal at the last minute.
A default remains unlikely but should it happen it would roil global markets, hamper economic recovery and lead to another wave of safe haven gold buying.
More likely, is that politicians once again raise the debt limit to over $17 trillion - thereby eliminating the short term crisis but increasing the likelihood of a far bigger crisis in the coming months and years.
Physical buying remains robust particularly in China and India where premiums are rising again as gold is snapped up by canny Asian value buyers.
Gold premiums in India, the world's biggest buyer of gold along with China, hit a record $100 an ounce due to a shortage of bullion to meet festival demand. In China, premiums in the Shanghai Gold Exchange climbed to over $20 an ounce from about $7 two weeks ago.
Gold has fallen about 4% since the government shutdown began on October 1, leading many to believe that if there is no debt deal, the price could shoot up, particularly should we get a significant bout of “risk off” in markets.
Gold In USD, 3 Days - (Bloomberg)
It is interesting to note that in 2011, gold rose in the months prior to the debt ceiling agreement. Then in the immediate aftermath of the debt ceiling extension agreement on August 2nd 2011, gold surged another 17% in 15 trading days after the agreement was reached. From August 1st to August 22nd, gold rose from $1,619/oz to over $1,900/oz.
The United States lost its important AAA credit rating from Standard & Poor's late on Friday August 5th, 2011, in a dramatic vote of no confidence for the world's largest economy and the U.S. dollar.
This was a catalyst for the surge to the record nominal high of $1,920/oz two weeks later.
Gold In USD, 10 Days - (Bloomberg)
How Fitch has not downgraded the U.S. already is a mystery to analysts looking at the U.S. fiscal position and the lack of political will to tackle it. It seems likely that significant political pressure is being put on credit ratings agencies regarding their credit rating of the U.S.
The very poor fiscal position of the U.S. will gradually erode confidence in the dollar which will see it continue to lose value against gold. The continuing depreciation of the dollar and the further downgrading of the U.S. credit rating from AAA will contribute to higher prices again.
The question is when, rather than if.
GoldCore’s 10th Anniversary Gold Sovereign & Storage Offer
Click For Details: Gold Sovereigns @ 5% Premium Over Spot (normally 8.5%-15% premium) & 1st Year's Storage @ Half Price


US Is Exceptional...It's the Largest Debtor Nation In the World
And yes, at some point the piper will have to be paid one way or another.
Subscribe to:
Posts (Atom)