The video of the squid is amazing. The absolute mindless banter of the ABC broadcasters, not so much. I would watch this on mute.
Tuesday, January 15, 2013
Apple's Shares Break Support on Elevated Volume, Next Stop
I guess the market is ignoring semi-positive comments from the Sterne Agee analyst who states....
Shaw Wu at Sterne Agee says weak demand is not a problem for Apple. In a new note he says, "As far as we can tell, iPhone 5 demand remains robust." He explains the cuts in orders as such: "(1) much improved yields meaning lower component builds and (2) supplier shifts."
Regardless of the bull or bear thinking on Apple's prospects, the market has spoken and investors are selling the shares. Today's sell off not only breaks the $500 price point, which will probably be touted as a major occurrence, thus creating a negative psychological feedback, but more importantly the stock broke the February 15th high volume resistance level. This is seen in the below chart.

Today's decline is on somewhat elevated volume. The break of the resistance puts into play the price gap to the $420 price point.
High Volume high/Volume Off tHe high for 1/14/13 Trading Day
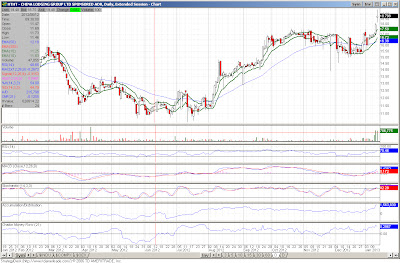
Took some time off yesterday, as I was a little under the weather. In any event there was no stock or fund that made the final cut to be volume off the high. As for new high volume highs, three names made the list. First there is Flower Foods, up on the news that it is buying brands from the defunct Hostess. Then there is CLSN, a biotech whose stock is up apparently on positive results from a drug in Phase III trials. Last, there is HTHT, a Chinese hotel concern. The stock is up on no direct news, but it may be gaining strength on a better economic outlook for China.


Sunday, January 13, 2013
Long-term Value Porfolio Update for Week Ending 1/11/13
For the most recent week, the Long-term Value Portfolio lost 50 basis points of value or 90 basis points relative to the market over the same time period, as the S&P 500 gained nearly 40 basis points (bps). Year-to-date, the portfolio remains in the positive column with a 3.3 percentage point gain or just over the market's gain of 3.2%. Since inception, the portfolio have gained 10.5% or 240 bps better than the market over the same comparable time period. This can seen in the chart below showing the portfolio (blue line) the S&P 500 (green) and the NASDAQ (brown)
 The loss on the week came primarily from underperformance of names in the consumer staples, energy, and materials sectors only partially offset by gains in financial, healthcare and telecom stocks.

VIX-Trading Portfolio Strategy Update for Week Ending 1/11/13
The VIX-Trading Portfolio had a decent performance week, gaining more than 2 percentage points of value or 1.7 points relative to S&P 500's gain of nearly 40 basis points. That said, the portfolio remains in the negative on a year-to-date basis and since inception on both an absolute and relative basis. The reasoning behind this underperformance was the short investment stance running up into the "resolution" of the fiscal cliff talks and the subsequent strong market performance. This performance characteristic is seen in the chart below with the blue line being the portfolio and the green and brown being the S&P 500 and NASDAQ, respectively.

The portfolio remains invested in the 2x S&P 500 Return ETF, as the standardized VIX data points towards a more bullish stance. Now one thing I have to admit is that the VIX-Trading Portfolio is less of a strategy and is more of a real-time experiment using the VIX data to gauge entry and exit points into the market. If and when I get more comfortable with the results using the data, I will begin to migrate the use of the signals into my portfolios and other trading/investing strategies. This is very much a work-in-progress.
To that end, I wanted to provide an update on the latest models historic performance characteristics, which I show graphically below.

The pink line above represents the performance of the black-box VIX-Trading Strategy. This model goes long the 2x long S&P 500 ETF following periods when the mode gives a buy signal and the 1x short S&P 500 ETF when it flashes a sell signal. The model passively accepts the market's return in all other cases. One word of caution, this model only represents past performance characteristics in the historical context. This is not to suggest that I will use any signal as solely as a black box nor would I suggest anyone do the same. I intend to use the signals in conjunction with other technical and fundamental measures to make trading calls that may or may be biased by the VIX model. If it is one thing I learned over the years is that any working investing model can and will fail at times and just passively accepting any signal from any model can result in significant underperformance.

The portfolio remains invested in the 2x S&P 500 Return ETF, as the standardized VIX data points towards a more bullish stance. Now one thing I have to admit is that the VIX-Trading Portfolio is less of a strategy and is more of a real-time experiment using the VIX data to gauge entry and exit points into the market. If and when I get more comfortable with the results using the data, I will begin to migrate the use of the signals into my portfolios and other trading/investing strategies. This is very much a work-in-progress.
To that end, I wanted to provide an update on the latest models historic performance characteristics, which I show graphically below.
The pink line above represents the performance of the black-box VIX-Trading Strategy. This model goes long the 2x long S&P 500 ETF following periods when the mode gives a buy signal and the 1x short S&P 500 ETF when it flashes a sell signal. The model passively accepts the market's return in all other cases. One word of caution, this model only represents past performance characteristics in the historical context. This is not to suggest that I will use any signal as solely as a black box nor would I suggest anyone do the same. I intend to use the signals in conjunction with other technical and fundamental measures to make trading calls that may or may be biased by the VIX model. If it is one thing I learned over the years is that any working investing model can and will fail at times and just passively accepting any signal from any model can result in significant underperformance.
Short-Trading Portfolio Update for the Week Ending 1/11/13
So far in 2013, the Short-Trading Portfolio has underperformed the market by 630 basis points (bps) and has declined by more than 3 percentage points since the turn of the year. Since inception,is showing a slight loss of -.02% or 210 basis points relative to the market over the same time period. The below chart shows this portfolio dynamic with the blue being the portfolio and the green and brown representing the S&P 500 and NASDAQ, respectively.

Most of the losses have occurred in the market run up following the fiscal cliff "resolution". However, I would note that the latest week's performance added to the recent losses, with the portfolio losing 70 basis points in value of 110 basis points relative to the market.

Most of the losses have occurred in the market run up following the fiscal cliff "resolution". However, I would note that the latest week's performance added to the recent losses, with the portfolio losing 70 basis points in value of 110 basis points relative to the market.
Long Trading Portfolio Update for Week Ending 1/11/13
The Long Trading Portfolio- which as a reminder tracks any long ideas I may post and suggest on this site- took on the chin this week. This can be seen in the below chart, tracking the performance of the portfolio (blue line) the S&P 500 (green) and the NASDAQ (brown).
 For the latest week, the portfolio declined by more than 5 percentage points, as the coal companies (both Arch Coal and Alpha Natural) took it on the chin. On a relative basis, it underperformed the S&P 500 by a wide margin, as the market gained nearly 40 basis points (bps). Since inception, the portfolio's performance remains positive with a gain of 10.2%, or 8.1% relative to the market, but is down relative to the market by 590 bps so far this year.

Subscribe to:
Posts (Atom)