An interview with John Williams from Shadowstats.com.
Monday, October 1, 2012
To catch a lie
I debated on posting this, as it is somewhat a commercial, but at the very least I thought it could serve as reminder to look into lie detection forensics at a later date.
Purchasing Managers' Index head fake
The Institute of Supply Management (ISM) reported their Purchasing Managers' Index (PMI) for September that was better than expected. The September PMI of 51.5 was 1.9 points better than the August print of 49.6. The Street had been looking for a 49.7 September print. The September PMI was up mainly due to an improvement in new orders, which increased 5.2 points to 52.3.
| MANUFACTURING AT A GLANCE SEPTEMBER 2012 |
||||||
|---|---|---|---|---|---|---|
Index |
Series Index Sep |
Series Index Aug |
Percentage Point Change |
Direction |
Rate of Change |
Trend* (Months) |
| PMI™ | 51.5 | 49.6 | +1.9 | Growing | From Contracting | 1 |
| New Orders | 52.3 | 47.1 | +5.2 | Growing | From Contracting | 1 |
| Production | 49.5 | 47.2 | +2.3 | Contracting | Slower | 2 |
| Employment | 54.7 | 51.6 | +3.1 | Growing | Faster | 36 |
| Supplier Deliveries | 50.3 | 49.3 | +1.0 | Slowing | From Faster | 1 |
| Inventories | 50.5 | 53.0 | -2.5 | Growing | Slower | 2 |
| Customers' Inventories | 49.5 | 49.0 | +0.5 | Too Low | Slower | 10 |
| Prices | 58.0 | 54.0 | +4.0 | Increasing | Faster | 2 |
| Backlog of Orders | 44.0 | 42.5 | +1.5 | Contracting | Slower | 6 |
| Exports | 48.5 | 47.0 | +1.5 | Contracting | Slower | 4 |
| Imports | 49.5 | 49.0 | +0.5 | Contracting | Slower | 2 |
| OVERALL ECONOMY | Growing | Faster | 40 | |||
| Manufacturing Sector | Growing | From Contracting | 1 | |||
This is a head fake and in my mind the improvement will not hold. I am holding my hat on the customer inventories index, which ticked up to 49.5 in September from 49 in August. This index typically runs inverse to the new orders index and should be looked at in reverse versus the other PMI measures, i.e. a low (high) number is a positive (negative). A high reading in the customer inventories index suggests that - without any corresponding increase in demand- that the channel manufacturers are selling in to is, to exaggerate, stuffed.
Looking back at history, the customer inventory index has averaged around 45. We have only seen 11 instances since 1997 when the new orders index ticked up in conjunction with the customer inventories while the customer inventories index was above 49. Two of those have occurred in the last three months. Excluding these data points, because of a lack of forward data, there have been only 3 instances when the PMI showed on uptick six months hence, or 33% positive PMI outcomes. Moreover, the central tendency for the PMI in the six months following the before mentioned setup is for a 2 point decline.
More worrisome is that the average and median PMI is held up by one data point, the six month forward results that occurred following the March 2009 PMI results, where the PMI rallied 18 points. I liken this to the fact that March 2009 corresponded with the bottom of the economic cycle, the ensuing snap-back in demand, and euphoria surrounding QE1, all of which are unlikely to be repeated. Excluding this data point, the PMI showed an average decline of more than 4 points. I would look for the PMI to, at best, muddle around the breakeven line over the next few months with a negative bias.
Cyclical/Non-cyclical stock and other divergences
Divergences between the S&P 500 and various relative price indicators continue to abound. For instance, the relative price of the Morgan Stanley Cyclical index (ticker $CYC) relative to the Dow Jones Consumer Index (ticker IYK).....

Or the relative price of the Russell 2000 small cap index versus the Russell 1000 large cap index.
 The track of the Russell 2000/Russell 1000 relative price generally follows the same trend as the cyclical/non-cyclical relative price. However, there are some divergences, which I think are important. In addition, the Russell indexes are a more broad representation of the economy.
The last relative price of note is the divergence in the relative price of Barclays High Yield ETF (ticker JNK) and the UShares IBOXX Investment Grade Corporate Bond fund (ticker LQD).
First, a three year view

And a one year view

These indicators suggest to me that the risk trade is coming off.

Or the relative price of the Russell 2000 small cap index versus the Russell 1000 large cap index.

The last relative price of note is the divergence in the relative price of Barclays High Yield ETF (ticker JNK) and the UShares IBOXX Investment Grade Corporate Bond fund (ticker LQD).
First, a three year view

And a one year view

These indicators suggest to me that the risk trade is coming off.
The river on Mars
From Scientific American...
........Now Curiosity has come across the ground-truth, including a rocky outcrop that is made of gravelly pebbles (clasts) cemented together into a crusty conglomerate. This is a chunk of up-tilted, uplifted ancient stream bed. The pebbles probably originated from the crater rim a few hundred meters higher up and their range of sizes, somewhat rounded shapes and placement all point towards their having been washed and rolled in water that was somewhere between ankle and hip deep.
Very cool stuff
Volume off the high 9/28/12- more homebuilders.
I was on the fence on including Lennar on the stocks selling off near the highs on volume. Yes, the stock does fit the initial screen, and yes the volume has been higher than average with the stock coming off the $38 high. That said, the down trend does not appear significantly strong, and would like to see a greater volume spike off the high. I finally decided to include the stock because in the strictest sense, it does hit the criteria and it fits the theme of homebuilder and related stocks hitting the screen.
Lennar- LEN
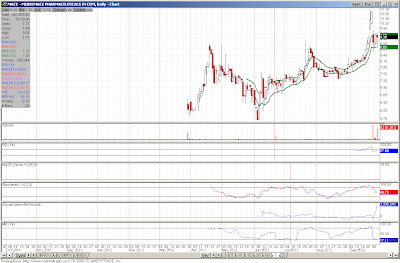
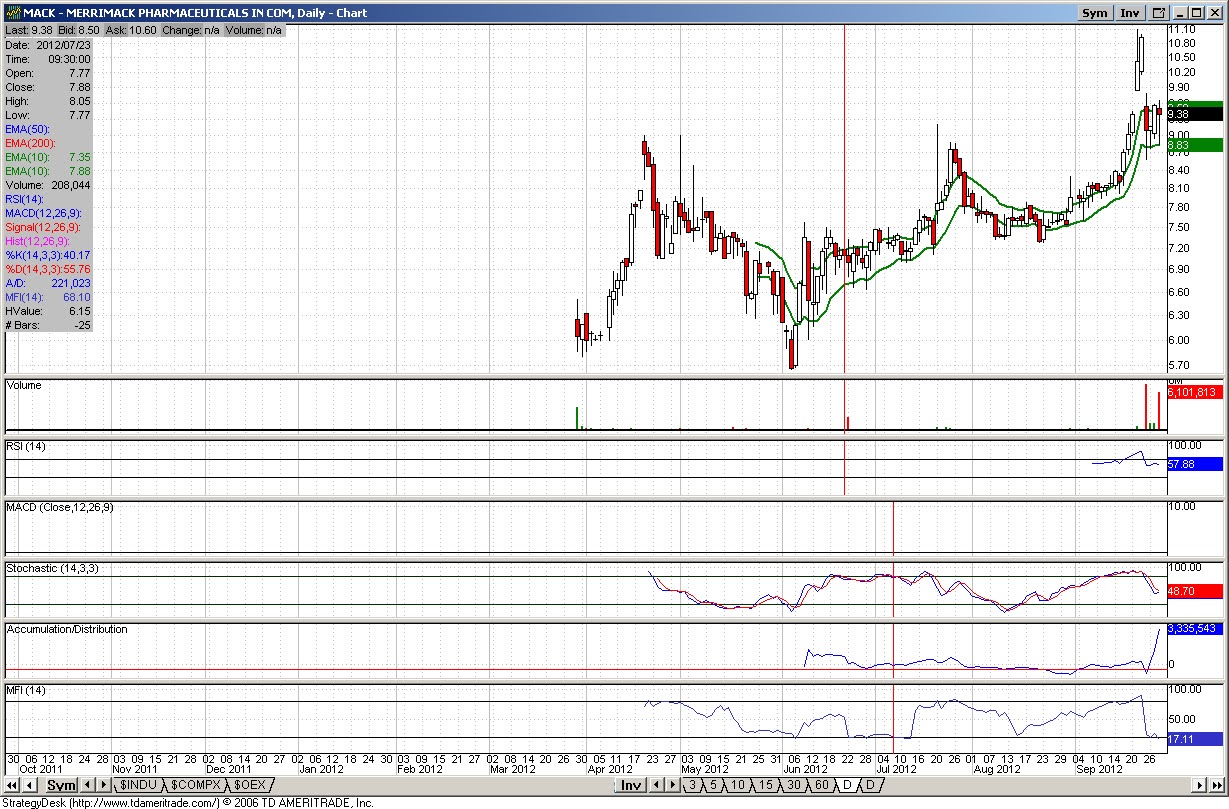
 Merrimack Pharma- MACK
 Delaware Municipal Income Fund- VCF
 Western Asset Management- WMC
 WP Carey- WPC

Lennar- LEN


Volume off the high for 9/27/12, homebuilders and related stocks showing some weakness
Never did get to this update over the weekend. However, I did want to keep the list going, at least for continuities sake. One interesting note, many of the homebuilder stocks are hitting the initial screens. Although they do not make the final cut- because of a lack of volume conviction- I find it interesting that the industry appears to be selling off. In addition, many homebuilding related names are making the final cut of stocks selling off near high on heavy volume. My thoughts are that any significant sell off in the group would present a buying opportunity, but the number of companies hitting the screens warrants further research.
Arlington Asset Investment Corp- AI
 Capstead Mortgage- CMO
 Morgan Stanley Emerging Markets- EDD
 HB Fuller- FUL
 IQ US Real Estate Small Cap ETF- ROOF
 Sociedad Quimica Minera- SQM

Arlington Asset Investment Corp- AI


Subscribe to:
Posts (Atom)